Instaforex Analysis

Forex broker related topics and discussions

Re: Instaforex Analysis

Postby IFX Gertrude » Wed Dec 22, 2021 3:11 am

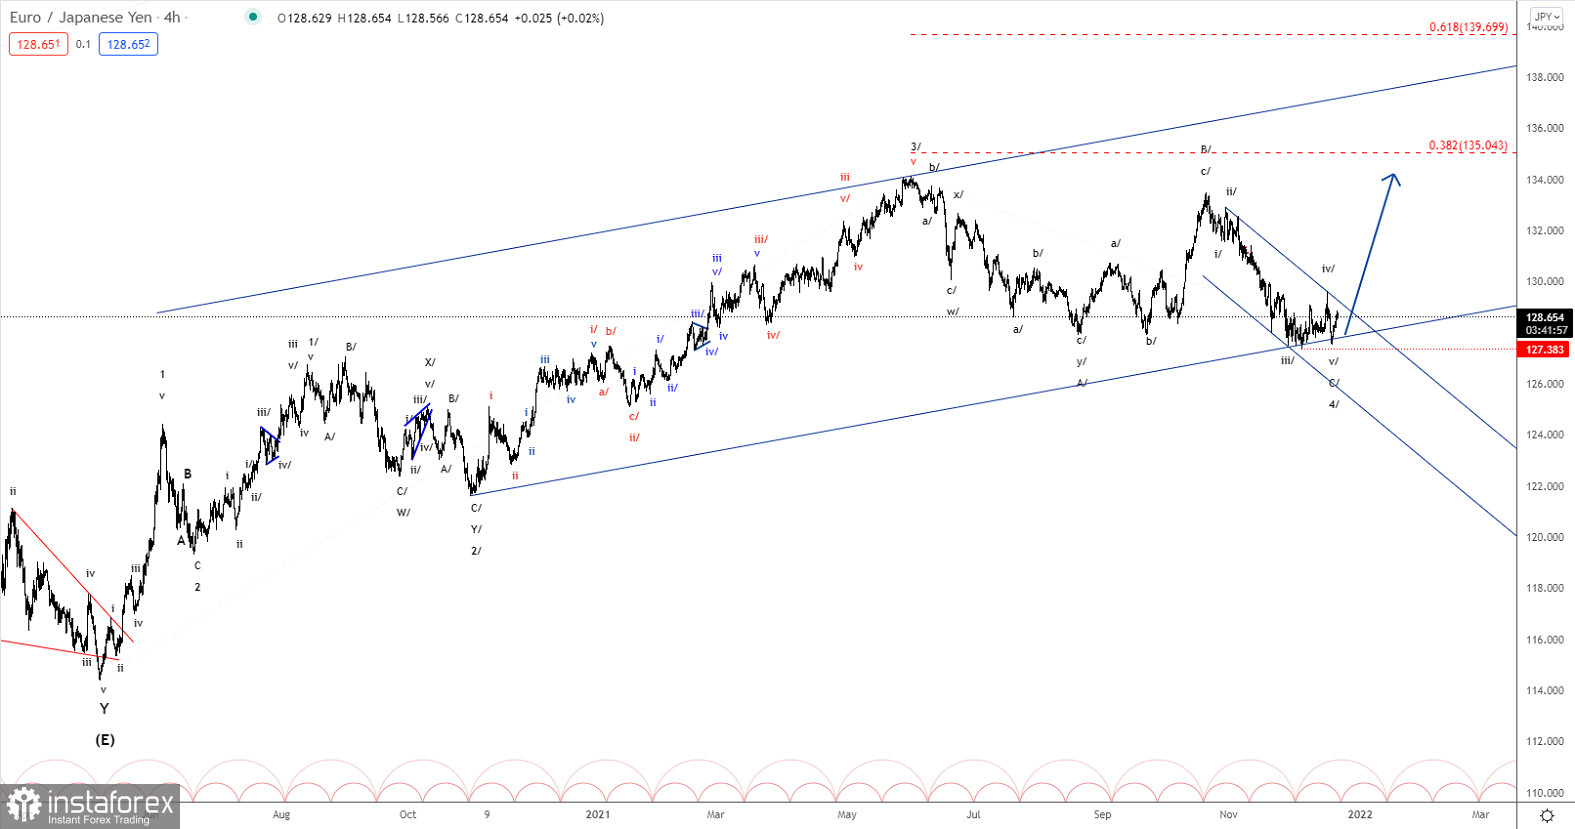
Forex Analysis & Reviews: Elliott wave analysis of EUR/JPY for December 22, 2021

Image

EUR/JPY is clearly in its final stages of the correction near wave 4/. All we need is a break above minor resistance at 129.64 to confirm that wave 4/ is completed and wave 5/ of 3 is in motion towards at least 135.04 and possibly even closer to the 139.70 target. This will complete wave 3 and set the stage for another wave 4 correction,. However, first we need to stay alert to signs that wave 4/ is completed and wave 5/ is in motion. The best thing that can happen is a break above minor resistance at 129.64 to confirm that wave 5/ is in motion.

*The market analysis posted here is meant to increase your awareness, but not to give instructions to make a trade.

Analysis are provided byInstaForex.
Best regards, PR Manager

Learn more about InstaForex Company at http://instaforex.com
IFX Gertrude
 
Posts: 5198
Joined: Wed Nov 07, 2012 6:25 am

Re: Instaforex Analysis

Postby IFX Gertrude » Thu Dec 23, 2021 1:47 am

Forex Analysis & Reviews: Forecast for EUR/USD on December 23, 2021

Yesterday, the euro decided to choose an upward direction, intending to complicate and lengthen the horizontal movement, which began on November 29-30. There are about 20 points until the resistance of the MACD line (1.1363), and without breaking the main scenario and its own sideways movement, it is likely that the price will turn down from this resistance. If it overcomes the 1.1363 level, the main scenario will change to a price reversal from the target level of 1.1415. But if the price settles above 1.1415, then an alternative scenario will take effect with the price rising to the target level of 1.1572 (the January 2019 high).

Image

An interesting situation develops on the Marlin Oscillator. Yesterday's exit of the signal line from the rectangular area of consolidation, marked with a gray area, repeats the exit of the signal line from the same consolidation on October 28 - it is marked with a red oval. And, as you can see, after the signal line returned to the range, the price fell.

Image

On the four-hour chart, the price settled above the MACD line, Marlin is confidently rising in the positive area - the situation is upward. Probably, the price will decide to test the strength of the resistance range of 1.1363-1.1415.

Analysis are provided byInstaForex.
Best regards, PR Manager

Learn more about InstaForex Company at http://instaforex.com
IFX Gertrude
 
Posts: 5198
Joined: Wed Nov 07, 2012 6:25 am

Re: Instaforex Analysis

Postby IFX Gertrude » Fri Dec 24, 2021 2:08 am

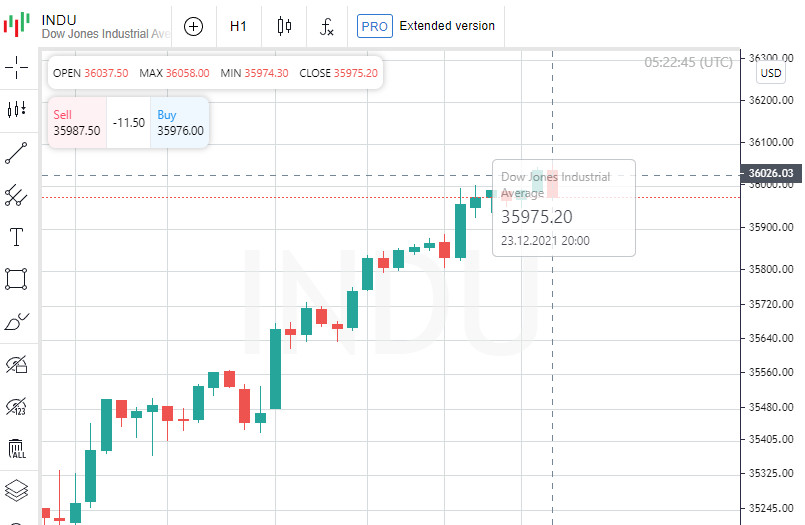
Forex Analysis & Reviews: US shares higher at close of trade; Dow Jones up 0.55%
Image

At the close in New York, the Dow Jones gained 0.55%, the S&P 500 rose 0.62% and the NASDAQ Composite rose 0.85%.

In the leaders of growth among the components of the Dow Jones at the end of today's trading were shares of Caterpillar Inc, which increased in price by 4.05 points (2.00%), to close at around 206.20. Dow Inc added 1.68% or 0.91 points to end trade at 55.14. Honeywell International Inc rose 1.67% or 3.38 points to close at 205.22.

The biggest losers were Visa Inc Class A, which fell 0.61% or 1.34 points to end the session at 216.62. Merck & Company Inc is up 0.56% or 0.43 points to end at 75.73 and Walmart Inc is 0.22% or 0.31 points down to 139. , 49.

The leaders of growth among the components of the S&P 500 at the end of today's trading were Tesla Inc, which rose 5.76% to 1.067.00, ViacomCBS Inc, which gained 4.80% to close at 30.58, and shares Micron Technology Inc rose 4.52% to end the session at 94.42.

The biggest losers were Coterra Energy Inc, which fell 1.82% to close at 19.39. Hologic Inc shed 1.42% to end the session at 76.12. Pfizer Inc was down 1.41% to 58.71.

The growth leaders among the components of the NASDAQ Composite index at the end of today's trading were shares of 22nd Century Group Inc, which rose 38.64% to the level of 3.050, Oncology Institute Inc, which gained 38.46%, to close at 10.44, and Pasithea Therapeutics Corp rose 36.73% to trade at 2.01 at the close.

The biggest losers were InnovAge Holding Corp, which fell 35.64% to close at 5.31. Jupiter Wellness Inc shed 24.89% to trade at 0.954. American Virtual Cloud Technologies Inc was down 24.00% to 1,900.

On the New York Stock Exchange, the number of securities that went up (2,289) exceeded the number of securities that closed in the red (971), while the quotations of 126 shares remained virtually unchanged. On the NASDAQ stock exchange 2679 companies rose in price, 1163 declined, and 181 remained at the level of the previous close.

The CBOE Volatility Index, which is based on S&P 500 options trading, fell 3.60% to 17.96, hitting a fresh monthly low.

Gold Futures for February delivery was up 0.42% or 7.65 to $ 1.809.85 a troy ounce. Elsewhere, WTI crude for February delivery rose 1.32%, or 0.96, to $ 73.72 a barrel. Futures contracts for Brent oil for March delivery rose 0.01%, or 0.01, to trade at $ 76.61 a barrel.

Meanwhile, on the Forex market, EUR / USD was up 0.03% to hit 1.1331, while USD / JPY was up 0.04% to hit 114.41.

The US Dollar Index Futures was down 0.02% at 96.035.

Analysis are provided byInstaForex.
Best regards, PR Manager

Learn more about InstaForex Company at http://instaforex.com
IFX Gertrude
 
Posts: 5198
Joined: Wed Nov 07, 2012 6:25 am

Re: Instaforex Analysis

Postby IFX Gertrude » Mon Dec 27, 2021 3:14 am

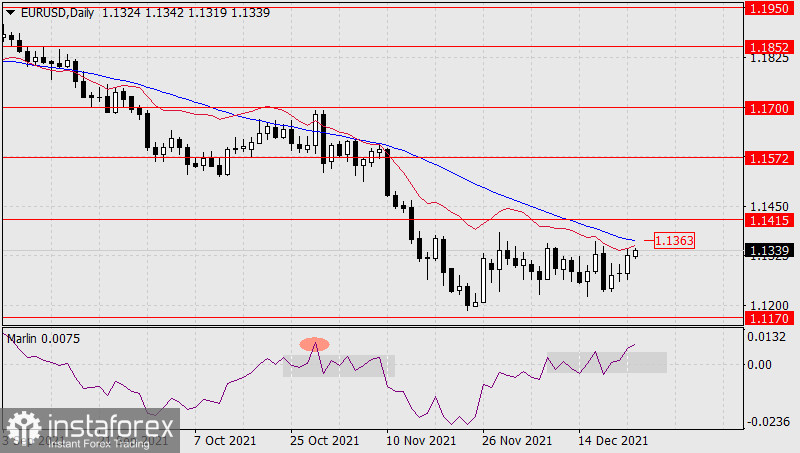
Forex Analysis & Reviews: Forecast for EUR/USD on December 27, 2021

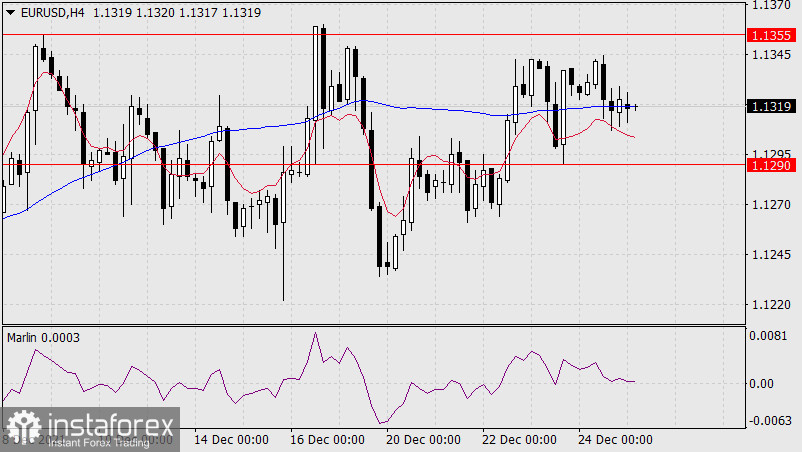
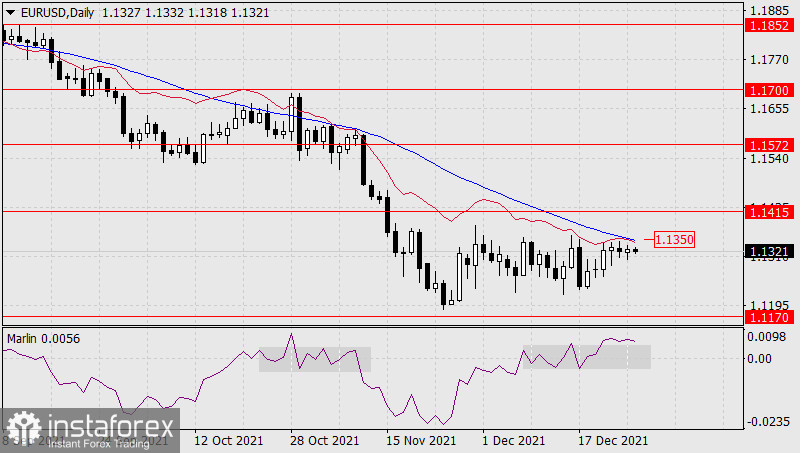
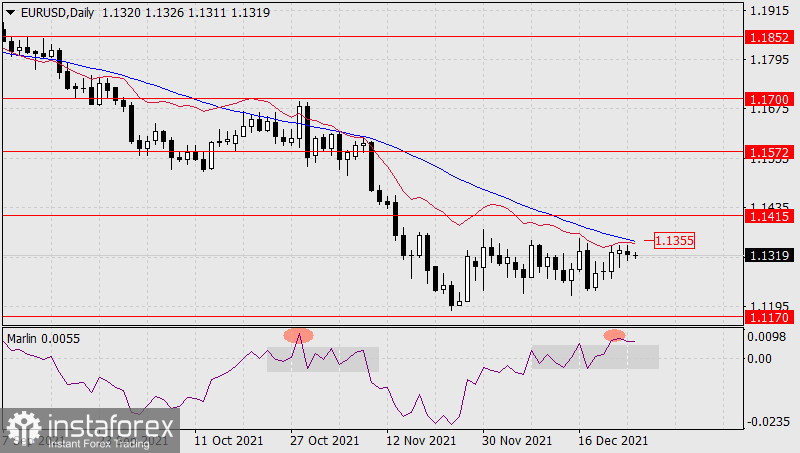
The euro opened the last trading week of 2021 in the upper half of the monthly range, before the resistance of the MACD line on the daily scale chart (1.1355). The price's exit above this resistance will open the nearest target of 1.1415. This is possible even today because of the thin market - UK investors are resting, but if American players wanted to go above 1.14, they would have already done it under more favorable circumstances. Now, if you use the thin market for strategic purposes, it is more convenient to strengthen the dollar. Or not to take any action, that is, to remain sideways until January, until the United States clarifies its geopolitical goals. Situationally, it turns out that it is more profitable to buy dollars. For this case, the 1.1170 target is always open.

Image

According to the Marlin Oscillator, a reversal pattern remains, repeating the technical pattern of October-November 2021 - the signal line of the oscillator may return to the side range marked with a gray rectangle and go down from it.

Image

*The market analysis posted here is meant to increase your awareness, but not to give instructions to make a trade.

Analysis are provided byInstaForex.
Best regards, PR Manager

Learn more about InstaForex Company at http://instaforex.com
IFX Gertrude
 
Posts: 5198
Joined: Wed Nov 07, 2012 6:25 am

Re: Instaforex Analysis

Postby IFX Gertrude » Tue Dec 28, 2021 2:26 am

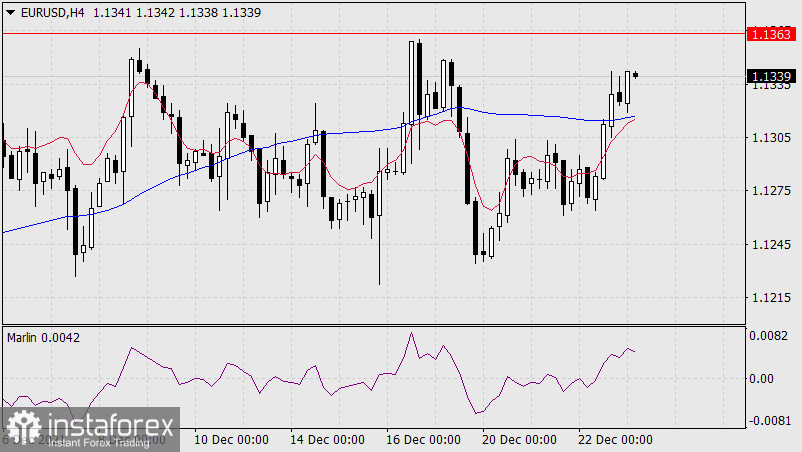
Forex Analysis & Reviews: Forecast for EUR/USD on December 28, 2021

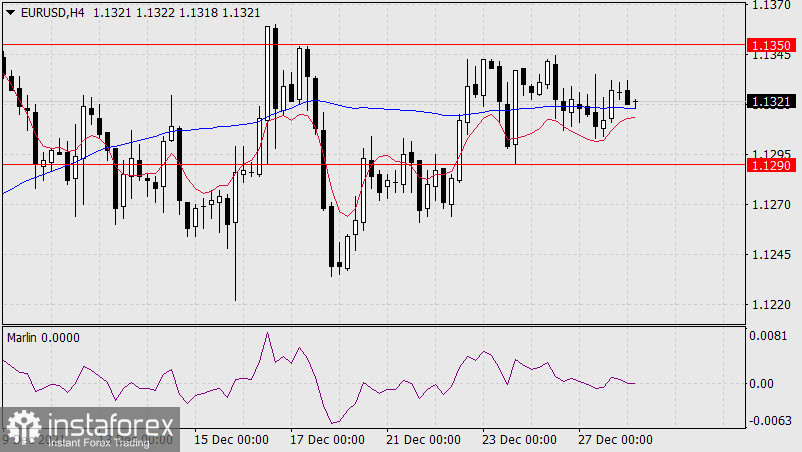
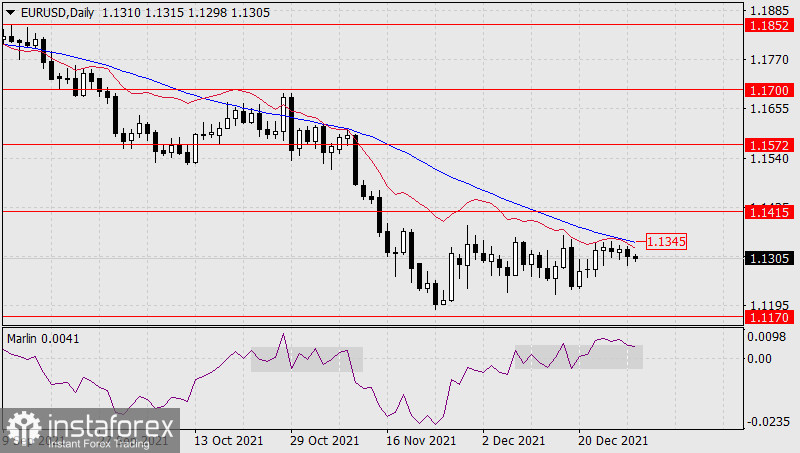
For the fourth day, the euro is moving in a narrow sideways direction under the MACD indicator line on the daily scale chart. And the longer this sideways trend lasts, the more likely the price will break above this indicator line (1.1350). The signal line of the Marlin Oscillator moves strictly horizontally above the consolidation range marked with a gray rectangle, which ultimately creates a forecast for the following technical picture: the price will break above the MACD line (1.1350), but for a very short time, return below it, the Marlin Oscillator will return to its own consolidation and the price will continue to decline towards the target of 1.1170. In this case, the target level 1.1415 may not be reached. But if the euro is able to overcome the situation, breaks above 1.1415, then further growth will continue to the target level of 1.1572.

Image

On the four-hour scale chart, the price settled above the MACD line, the Marlin Oscillator, after a false move into the negative zone, returned to the positive area. These are signs that the price is preparing to jump up to the 1.1350 resistance with the intention of breaking it.

Image

*The market analysis posted here is meant to increase your awareness, but not to give instructions to make a trade.

Analysis are provided byInstaForex.
Best regards, PR Manager

Learn more about InstaForex Company at http://instaforex.com
IFX Gertrude
 
Posts: 5198
Joined: Wed Nov 07, 2012 6:25 am

Re: Instaforex Analysis

Postby IFX Gertrude » Wed Dec 29, 2021 1:27 am

Forex Analysis & Reviews: Forecast for EUR/USD on December 29, 2021

Over the past day, the price of the single European currency has outlined a tendency to move away from the MACD indicator line on the daily scale chart.

Image

The price does not dare to test the strength of the resistance formed by the merger of two indicator lines - the balance line and the MACD line (1.1345). The signal line of the Marlin Oscillator returns to the range of December 8-21, marked on the oscillator chart with a gray rectangle. The price probably decided to choose the path of less resistance and headed towards the first bearish target of 1.1170. The probability of surpassing the area above the resistance level of 1.1345 has become noticeably lower.

Image

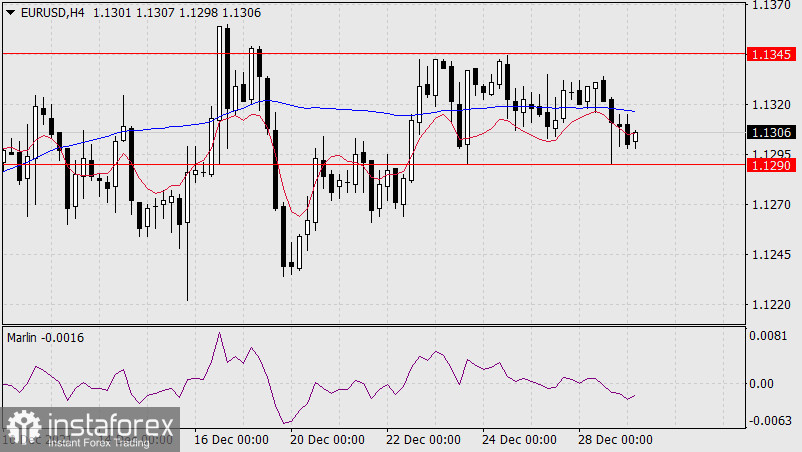
On the four-hour chart, the price returned under the MACD line and managed to settle below it. The price also crossed the balance indicator line. The Marlin Oscillator is in a downward trend zone. The descending scenario becomes the main one. *The market analysis posted here is meant to increase your awareness, but not to give instructions to make a trade.

Analysis are provided by InstaForex
Best regards, PR Manager

Learn more about InstaForex Company at http://instaforex.com
IFX Gertrude
 
Posts: 5198
Joined: Wed Nov 07, 2012 6:25 am

Re: Instaforex Analysis

Postby IFX Yvonne » Thu Dec 30, 2021 8:08 am

Forecast for EUR/USD on December 30, 2021

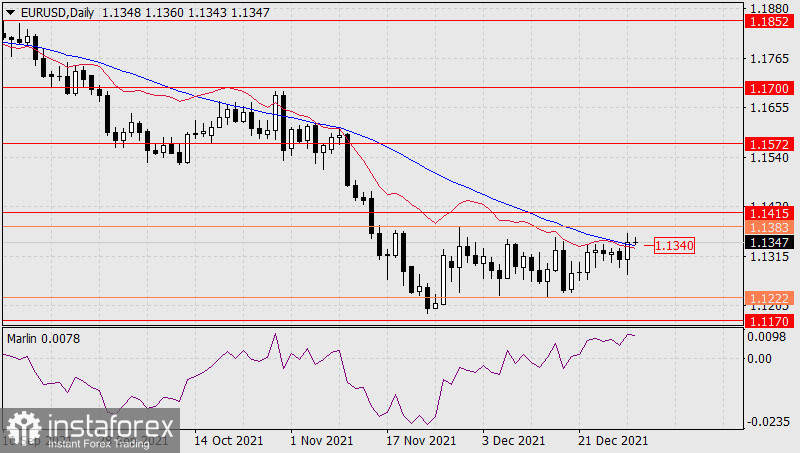
Yesterday the euro traded in a range of more than 90 points, overcoming the resistance of the balance and MACD indicator lines at the end of the day. An unpleasant surprise did take place.

Image

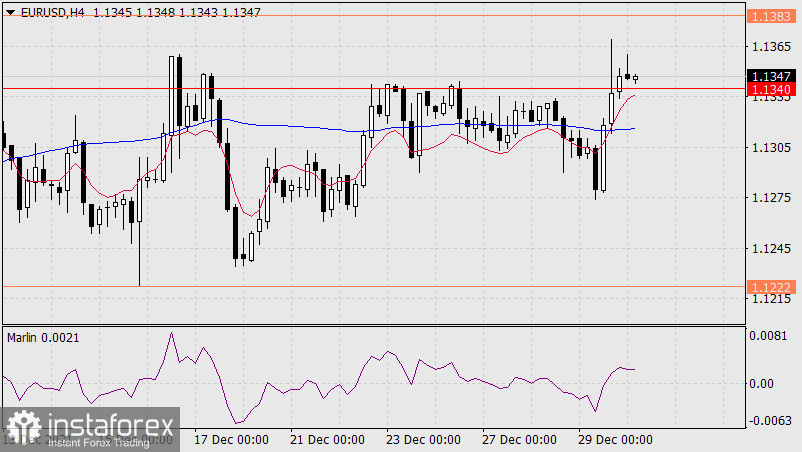
But we are in no hurry to announce that the price will mark near any bullish target level, and here the nearest target is 1.1415. The signal line of the Marlin Oscillator can turn down, and the price can just as easily return to yesterday's low. The reason for this will be the fact that the euro grew without a pronounced risk appetite in adjacent markets. US stocks showed mixed closings. US government bonds have undergone sales, but this trend has been going on for ten days and raises new questions - where does the money go from the US market? There is no answer to this question yet. The Treasury is rapidly increasing its debt and formally this should keep the demand for the dollar. The current debt is 29.443 trillion dollars. In the end, the euro has been moving sideways for a month, and until the price breaks out of this sideways side (1.1222-1.1383), it is too early to link the euro's movements with external events.

Image

On the four-hour chart, the indicator of the Marlin Oscillator moves horizontally, the price periodically goes above and below the line. The Marlin Oscillator is also in a wide-range sideways trend, at the moment it shows an intention to turn down from the positive area.

So, yesterday's rise in prices showed the uncertainty of the euro. And no one knows when it will end. January and February can be challenging geopolitically.


*The market analysis posted here is meant to increase your awareness, but not to give instructions to make a trade.
Best Regards,
PR Manager
InstaForex Companies Group
User avatar
IFX Yvonne
 
Posts: 287
Joined: Sat Mar 02, 2013 12:23 am

Re: Instaforex Analysis

Postby IFX Gertrude » Fri Dec 31, 2021 3:24 am

Forex Analysis & Reviews: USDCAD, Bearish Pressure | 31st Dec 2021

Image

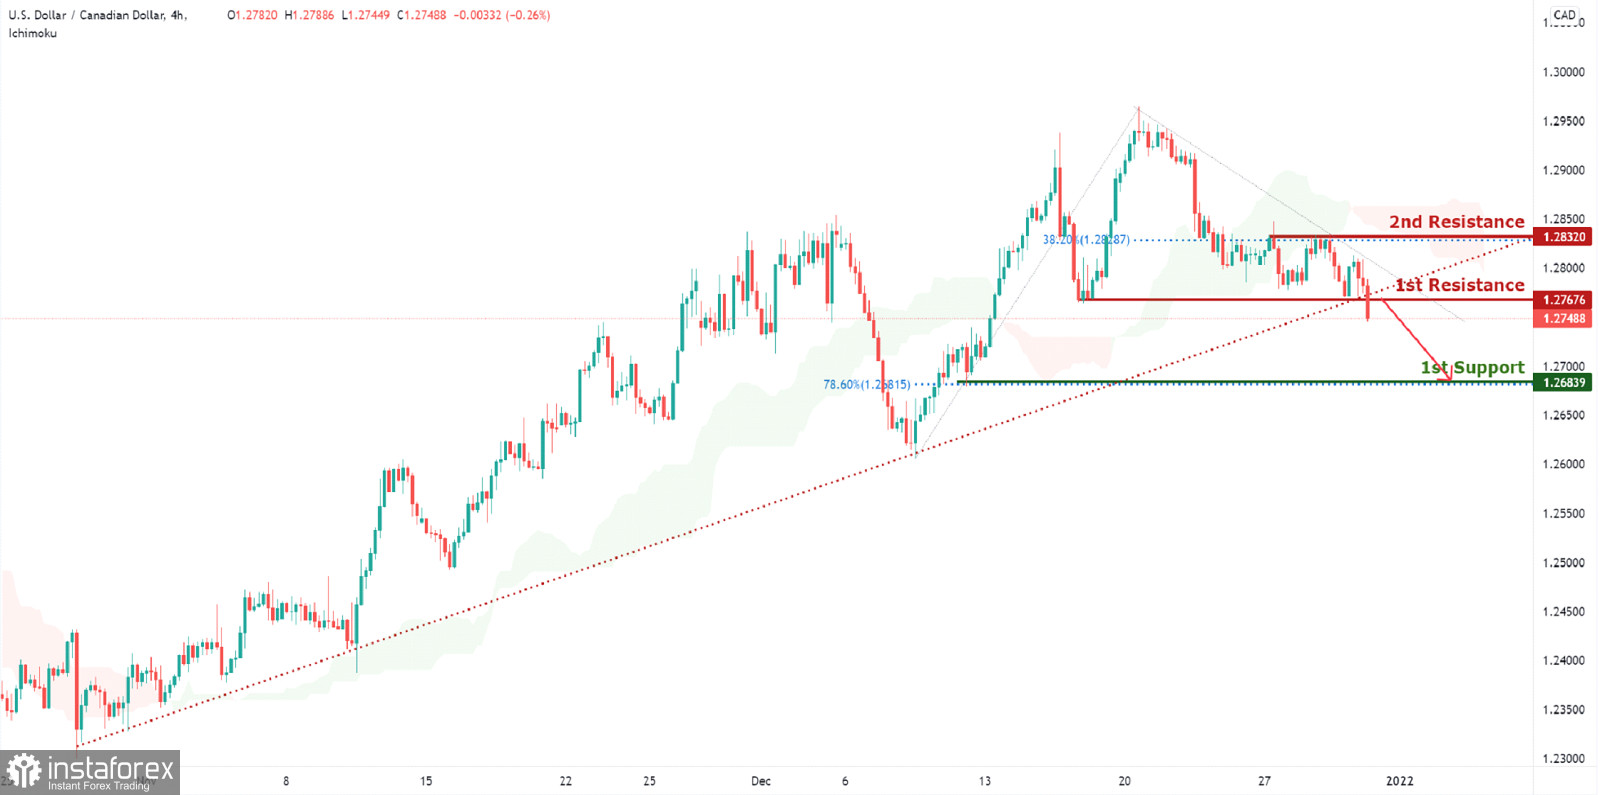
On the H4, with price breaking the ascending trendline at 1st resistance of 1.27676 which is in line with horizontal overlap resistance, price can potentially drop to 1st support at 1.26839, which is in line with horizontal swing low support, 78.6% Fibonacci retracement level. Alternatively, price may rise up to 2nd resistance at 1.2832, which coincides with horizontal swing high resistance, 38.2% Fibonacci retracement level . This is further supported by how price is now holding below the Ichimoku cloud resistance.

Trading Recommendation
Entry: 1.27676
Reason for Entry:
Horizontal overlap resistance, Ascending trendline breakout
Take Profit: 1.26839
Reason for Take Profit:
Horizontal swing low support, 78.6% Fibonacci retracement level
Stop Loss: 1.2832
Reason for Stop Loss:
Horizontal swing high resistance, 38.2% Fibonacci retracement level

Analysis are provided byInstaForex.
Best regards, PR Manager

Learn more about InstaForex Company at http://instaforex.com
IFX Gertrude
 
Posts: 5198
Joined: Wed Nov 07, 2012 6:25 am

Re: Instaforex Analysis

Postby IFX Gertrude » Mon Jan 03, 2022 2:19 am

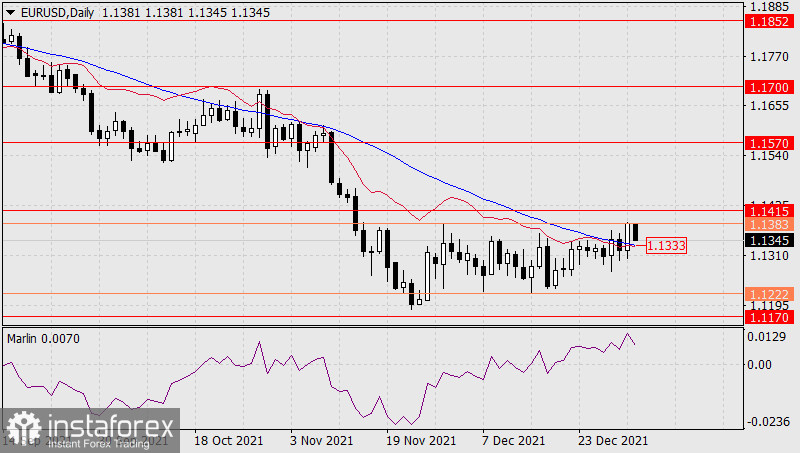
Forex Analysis & Reviews: Forecast for EUR/USD on January 3, 2022

The euro rose by 64 points on Friday, the last day of 2021. It tested the signal level of 1.1383, and this morning it is moving down from it. A reversal under the MACD line, below 1.1333, will set the downward momentum to the lower border of the free roaming range (1.1222).

Image

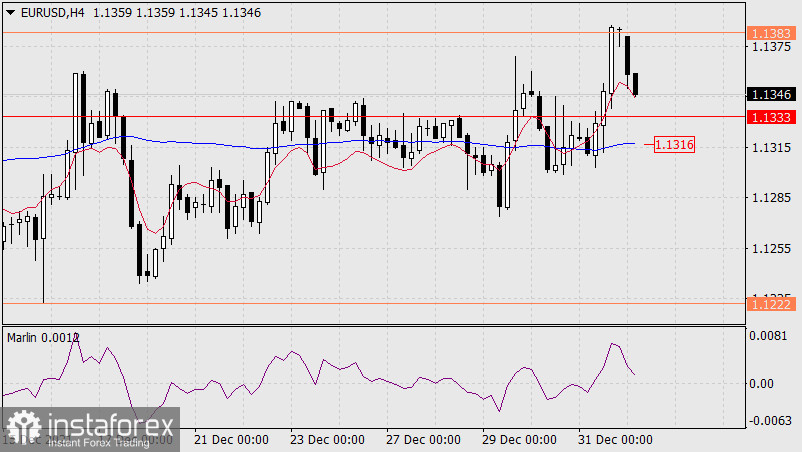
On the four-hour chart, the price is developing in a growing position, since the price is above the balance (red) and MACD (blue) indicator lines. The MACD line is an indicator of the local trend, and it generally moves horizontally.

Image

In this case, the main indicator of market sentiment will be price taking above or below this line with a confirmation signal from the Marlin Oscillator. At the moment, we see a signal for growth, but Marlin began to show a downward reversal almost vertically, this is a sign of price attack on support (1.1333). And since the MACD line (1.1316) is located below the level of 1.1333, then for the complete formation of conditions for a decline, it is necessary to consolidate below this indicator line.

An exit above 1.1383 could create a reactionary rally towards the 1.1415 target level. Consolidating above it will become a condition for further growth to the level of 1.1570 (January 2019 high).

*The market analysis posted here is meant to increase your awareness, but not to give instructions to make a trade.

Analysis are provided byInstaForex.
Best regards, PR Manager

Learn more about InstaForex Company at http://instaforex.com
IFX Gertrude
 
Posts: 5198
Joined: Wed Nov 07, 2012 6:25 am

Re: Instaforex Analysis

Postby IFX Gertrude » Tue Jan 04, 2022 2:02 am

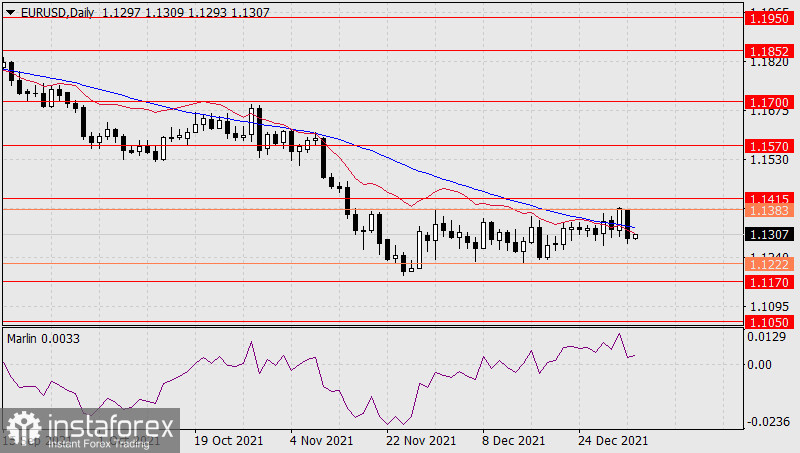
Forex Analysis & Reviews: Forecast for EUR/USD on January 4, 2022

Finally, the euro has made its choice. Yesterday, on solid volumes (despite the fact that there was a day off in Japan and Great Britain), the price went under the daily-scale balance and MACD indicator lines, and this movement was the largest since November 26 (but then there was a price increase). Now the euro is facing the nearest target of 1.1170, but such a powerful start clearly indicates that the target is deeper, for example, 1.1050 - the high of March and December 2015.

Image

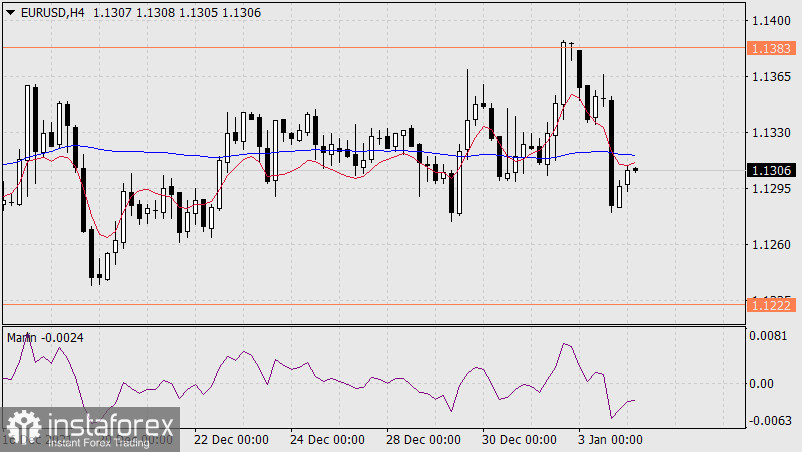
On the four-hour scale chart, the price also went under the balance and MACD indicator lines, settled below them, Marlin is in the downward trend zone. We are waiting for the price at the first target of 1.1170.

Image

*The market analysis posted here is meant to increase your awareness, but not to give instructions to make a trade.

Analysis are provided byInstaForex.
Best regards, PR Manager

Learn more about InstaForex Company at http://instaforex.com
IFX Gertrude
 
Posts: 5198
Joined: Wed Nov 07, 2012 6:25 am

PreviousNext

Return to Forex Brokers


cron