Instaforex Analysis

Forex broker related topics and discussions

Re: Instaforex Analysis

Postby IFX Bella » Tue Dec 30, 2025 6:05 am

Forex Analysis & Reviews: Trading Signals for GOLD for December 29-31, 2025: sell below $4,375 (rebound - 8/8 Murray)

Image

Gold is trading around $4,324, rebounding after reaching the December 18 support zone around $4,312. Gold could recover some of its losses in the coming hours and could reach 8/8 Murray around $4,375. This level could be seen as an opportunity to resume selling operations. If gold falls below yesterday's low and consolidates below $4,300, we could expect it to reach the 200 EMA around $4,260 and potentially accelerate its decline to reach the 6/8 Murray level around $4,062. If gold continues to rebound in the coming hours, we could expect strong resistance at $4,375 to take short options with short-term targets around $4,260 and $4,200. If gold consolidates above $4,375, the outlook could be positive. The price is expected to reach the 21 SMA around $4,467. This level is key as it represents the 61.8% Fibonacci level, which could be seen as an opportunity to open short positions. If our strategy is to buy, we could look for opportunities to open long positions above $4,320 with targets at $4,375 and $4,450.

Analysis are provided by InstaForex.

Read more: https://ifxpr.com/3YhKhQs
IFX Bella
 
Posts: 560
Joined: Sat Dec 08, 2012 12:39 am

Re: Instaforex Analysis

Postby IFX Bella » Wed Dec 31, 2025 4:41 am

Forex Analysis & Reviews: Trading Signals for GOLD for December 30-31, 2025: buy above $4,325 (21 SMA - 0/8 Murray)

Image

Gold is trading around $4,357, below the 8/8 Murray and within the upward trend channel formed since December 10. The H4 chart shows consolidation above $4,325. Technically, gold is under bearish pressure and is likely to continue its negative cycle in the coming days. We expect it to reach the 200 EMA around 4,269 and then finally reach the 7/8 Murray level around $4,218. If gold consolidates within the uptrend channel in the coming hours and if the price remains above $4,315, the outlook could be positive, and we could expect it to reach $4,375. Finally, it could reach the 21 SMA around $4,434. Gold has left a double top pattern formation when it reached the $4,550 levels, which gave gold a strong technical correction. Looking at the facts, it is likely that the bearish sequence will continue in the coming days until the instrument reaches the psychological level of $4,000. The Eagle indicator is approaching oversold levels, but gold could still be at risk of further declines in the coming days, so we should be cautious and could sell in the event of a pullback below the 0/8 Murray or below the 21 SMA.

Analysis are provided by InstaForex.

Read more: https://ifxpr.com/44QkEKk
IFX Bella
 
Posts: 560
Joined: Sat Dec 08, 2012 12:39 am

Re: Instaforex Analysis

Postby IFX Bella » Thu Jan 01, 2026 3:11 am

Forex Analysis & Reviews: GBP/USD. Smart Money. The Pound Is Also Preparing for a "Bullish" Signal

The GBP/USD pair rebounded from the "bullish" imbalance 11 and resumed its growth, as I had warned. At the moment, buy positions are showing a profit of about 350 points, and traders can decide for themselves what to do with them next. In my view, the "bullish" trend has not ended; the offensive that began in the first ten days of November is not yet complete. There is not a single workable "bearish" pattern in the pound that could be expected to trigger a bearish attack. On the contrary, another "bullish" pattern has appeared, which may become a support for a new bullish offensive—most likely next year.

Image

Last week, another "bullish" imbalance 12 was formed, and today the price has worked it off. Thus, today or on Friday the price may react to it, and traders may receive a new "bullish" signal. I would like to note that the "imbalance" pattern usually consists of three candles, but in our case it can be considered to consist of four. Let me remind you that an imbalance is a "price slippage." On the chart, it is clearly visible that it took two daily candles, which the price literally flew through. Above the pound, there are practically no significant resistance zones. Thus, there are no "bearish" patterns, no reactions to bearish patterns, and no liquidity grabs from bullish swings. The current chart picture is as follows. The "bullish" trend in the pound can be considered complete, but the "bullish" trend in the euro is not. Thus, the European currency can pull the pound upward for as long as necessary. Bulls pushed off from bullish imbalance 1, bullish imbalance 10, and bullish imbalance 11 twice. A large number of buy signals were formed. A new support zone—imbalance 12—has formed below. Thus, I still expect growth toward the yearly highs, around the 1.3765 level. On Wednesday, the news background was absent. At the beginning of the new year, new graphical buy signals may appear, which will allow traders to open buy positions again. In the United States, the overall news background remains such that nothing but a decline in the dollar can be expected in the long term. The situation in the U.S. remains quite difficult. The government shutdown lasted a month and a half, and Democrats and Republicans agreed on funding only until the end of January. There has been no U.S. labor market data for a month and a half, and the latest figures can hardly be considered positive for the dollar. The last three FOMC meetings ended with "dovish" decisions, and the latest labor market data allows for a fourth consecutive easing of monetary policy in January. In my view, the bulls have everything they need to continue a new offensive and return to the yearly highs. A "bearish" trend would require a strong and stable positive news background for the U.S. currency, which is difficult to expect under Donald Trump. Moreover, the U.S. president himself does not need a strong dollar, as the trade balance would remain in deficit in that case. Therefore, I still do not believe in a bearish trend for the pound, despite the fairly strong decline in September and October. Too many risk factors remain hanging like dead weight over the dollar. On what basis do the bears intend to push the pound further down if a bearish trend is supposedly forming now? I cannot answer this question, so I do not believe that the dollar's decline will continue. If new bearish patterns appear, a potential decline in the pound sterling can be reconsidered. News Calendar for the U.S. and the UK: On January 2, the economic calendar contains no noteworthy events. The influence of the news background on market sentiment on Friday will be absent. GBP/USD Forecast and Trading Advice: For the pound, the picture remains favorable for traders. Three "bullish" patterns have already played out, signals have been formed, and traders can maintain buy positions. I see no informational grounds for a strong decline in the pound in the near future. A resumption of the "bullish" trend could have been expected already from imbalance zone 1. At the moment, the pound has reacted to imbalance 1, imbalance 10, and imbalance 11. As a target for potential growth, I am considering the 1.3725 level, but the pound may rise much higher—albeit next year. If "bearish" patterns form, the trading strategy may need to be reconsidered, but this week it is more likely that another "bullish" signal will be received from imbalance 12.

Analysis are provided by InstaForex.

Read more: https://ifxpr.com/4pmSVIu
IFX Bella
 
Posts: 560
Joined: Sat Dec 08, 2012 12:39 am

Re: Instaforex Analysis

Postby IFX Bella » Fri Jan 02, 2026 2:59 am

Forex Analysis & Reviews: Overview of the GBP/USD Pair. January 2. Double "Bullish" Signal for the Pound

Image

The GBP/USD currency pair traded quite actively on Wednesday for New Year's Day. Volatility reached as high as 74 pips, which is, of course, a bit low for the British currency but still significantly higher than for the euro. For most of the day, the pound declined, suggesting a correction was in the offing. But by the end of the day, month, and year, it nevertheless moved back up. Not just "moved back," but "rebounded," which is in itself very important. In the EUR/USD article, we mentioned an important technical buy signal. For GBP/USD, there were two such signals. The mere fact that buy signals formed on both currency pairs already says a lot. It is no secret that the euro and the pound most often trade in the same direction. Therefore, two identical signals increase the probability that they will work out. For the pound, the CCI indicator also formed another "bullish" divergence. The seventh or eighth such divergence in recent months, visible even on the 4-hour chart, although this entire period does not even fit on the illustration. Another bullish divergence on an uptrend is a signal of trend continuation. In addition, the CCI entered the oversold area, which is also a buy signal. Thus, on December 31, three buy signals were generated across the euro and the pound in a single day. This brings us back to the sharp rebound upward on Friday. Such candles are usually reversal patterns and actually indicate liquidity being taken out. Simply put, the price fell to levels where large pending buy orders were placed. The orders triggered — the price shot up. Therefore, we believe that we will already see growth in the pair today, and next week, accompanied by macroeconomic data on the labor market, unemployment, and US business activity, the dollar may well continue to fall. Recall that, in the medium term, the uptrend remains despite a prolonged, fairly strong correction. The price has crossed the Senkou Span B and Kijun-sen on the daily timeframe, which is another signal of an upward trend. Thus, again, everything indicates that the pound will rise and the dollar will fall.

Image

The average volatility of the GBP/USD pair over the last five trading days is 58 pips. For the pound/dollar, this value is "medium-low." On Friday, January 2, we therefore expect movement inside a range bounded by 1.3396 and 1.3510. The higher linear regression channel has turned upward, indicating trend recovery. The CCI entered oversold territory 6 times in recent months and formed numerous bullish divergences, repeatedly signaling a resumption of the uptrend. Nearest support levels: S1 – 1.3428 S2 – 1.3367 S3 – 1.3306 Nearest resistance levels: R1 – 1.3489 R2 – 1.3550 Trading recommendations: The GBP/USD pair is attempting to resume the 2025 uptrend, and its long-term prospects have not changed. Donald Trump's policies will continue to put pressure on the dollar, so we do not expect the US currency to appreciate. Thus, long positions with a target of 1.3550 remain relevant for the near term while the price is above the moving average. A price below the moving average allows consideration of small short positions on technical grounds, with targets at 1.3396 and 1.3367. From time to time, the US currency shows corrections (on a global scale), but for the trend to strengthen, it needs signs of an end to the trade war or other global positive factors. Explanations for illustrations: Linear regression channels help determine the current trend. If both are directed the same way, the trend is strong. The moving average line (settings 20, 0, smoothed) indicates the short-term trend and the direction in which trading should currently proceed. Murrey levels are target levels for moves and corrections. Volatility levels (red lines) indicate the likely price channel the pair will trade in over the next 24 hours, based on current volatility indicators. The CCI indicator — its move into the oversold area (below -250) or into the overbought area (above +250) indicates that a trend reversal to the opposite direction is imminent.

Analysis are provided by InstaForex.

Read more: https://ifxpr.com/3Lan0x0
IFX Bella
 
Posts: 560
Joined: Sat Dec 08, 2012 12:39 am

Re: Instaforex Analysis

Postby IFX Bella » Mon Jan 05, 2026 2:45 am

Forex Analysis & Reviews: GBP/USD. Weekly preview. From ship to ball

Image

The GBP/USD currency pair traded in both directions on Friday with reduced volatility. The average volatility over the past 1.5 months is 75 pips, which is relatively low. On Friday, volatility was even lower. However, the holidays are over, and traders will immediately be thrown into a whirlpool of events this week. We should begin with the events in Venezuela that occurred on Saturday. Trump, "who always backs down," this time moved from words to deeds and ordered the bombing of Caracas and other Venezuelan cities. Recall that for two months the U.S. president had been demanding that Venezuelan president Nicolas Maduro resign, warning that otherwise the U.S. would be forced to intervene. Trump accuses Maduro of sheltering drug trafficking and terrorism, which harm America. During the special military operation, Maduro was captured by U.S. forces and deported to the United States, where he is to stand trial. Frankly, it is difficult to say how the market will react to this event today, but the reaction may be quite strong. The dollar may well strengthen its position, but for how long? In the UK, there will be very few significant events and reports next week. But in the U.S.... The first working week of the month means that labor market and unemployment data will be published, on which traders currently base their trading primarily. However, in addition to these data, there will be other important reports that should not be ignored. On Monday, the ISM manufacturing PMI will be published, which risks remaining below the "waterline" for December. On Wednesday, the JOLTS, ADP, and ISM services reports will be released. The JOLTs report is unlikely to provoke a strong market reaction because it broadly reflects the state of the U.S. labor market. The ADP report is slightly more important and is unlikely to show a strong reading (judging by forecasts), while the ISM services index may fall for December from 52.6 to 52.3 points. On Friday, Nonfarm Payrolls and the unemployment rate for December will be published, along with the University of Michigan consumer sentiment index. The market expects that the number of jobs created outside the agricultural sector will be lower than in November, while the unemployment rate will remain unchanged at 4.6%. However, note that 60,000 new jobs is very little to call the U.S. labor market "recovering." Thus, during the current week, the dollar is more likely to fall than to rise. Overall, this is desirable because the technical picture still points to an uptrend, and with poor U.S. data, it will be much easier for both currency pairs to rise. At the same time, we remind you that forecasts are only forecasts, and actual report values often differ dramatically.

Image

The average volatility of the GBP/USD pair over the last five trading days is 64 pips. For the pound/dollar, this value is "medium-low." On Monday, January 5, we therefore expect movement within a range of 1.3392 to 1.3520. The higher linear regression channel has turned upward, indicating a trend recovery. The CCI indicator entered the oversold area 6 times over recent months and formed numerous "bullish" divergences, which repeatedly warned traders of the continuation of the uptrend. Nearest support levels: S1 – 1.3428 S2 – 1.3367 S3 – 1.3306 Nearest resistance levels: R1 – 1.3489 R2 – 1.3550 Trading recommendations: The GBP/USD pair is attempting to resume the 2025 uptrend, and its long-term prospects have not changed. Donald Trump's policies will continue to pressure the U.S. economy, so we do not expect the U.S. currency to appreciate. Thus, long positions with a target of 1.3550 remain relevant in the near term while the price is above the moving average. A price below the moving average suggests considering small short positions on technical grounds, with targets at 1.3392 and 1.3367. From time to time, the U.S. currency shows corrections (in the global context), but for a trend to strengthen, it needs signs of an end to the trade war or other global positive factors. Explanations for illustrations: Linear regression channels help determine the current trend. If both are directed the same way, the trend is strong; The moving average line (settings 20,0, smoothed) defines the short-term trend and the direction in which trading should currently be conducted; Murrey levels are target levels for moves and corrections; Volatility levels (red lines) are the likely price channel in which the pair will spend the next 24 hours based on current volatility indicators; The CCI indicator — its entry into the oversold area (below -250) or into the overbought area (above +250) indicates that a trend reversal to the opposite direction is approaching.

Analysis are provided by InstaForex.

Read more: https://ifxpr.com/498Ov36
IFX Bella
 
Posts: 560
Joined: Sat Dec 08, 2012 12:39 am

Re: Instaforex Analysis

Postby IFX Bella » Tue Jan 06, 2026 3:36 am

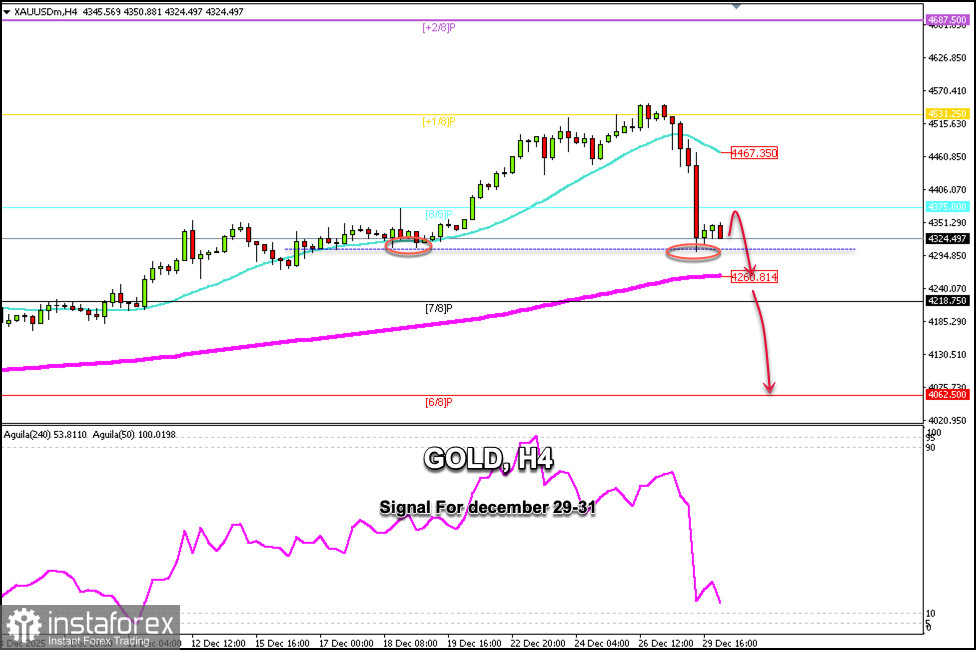
Forex Analysis & Reviews: EUR/USD Overview on January 6, 2026

Image

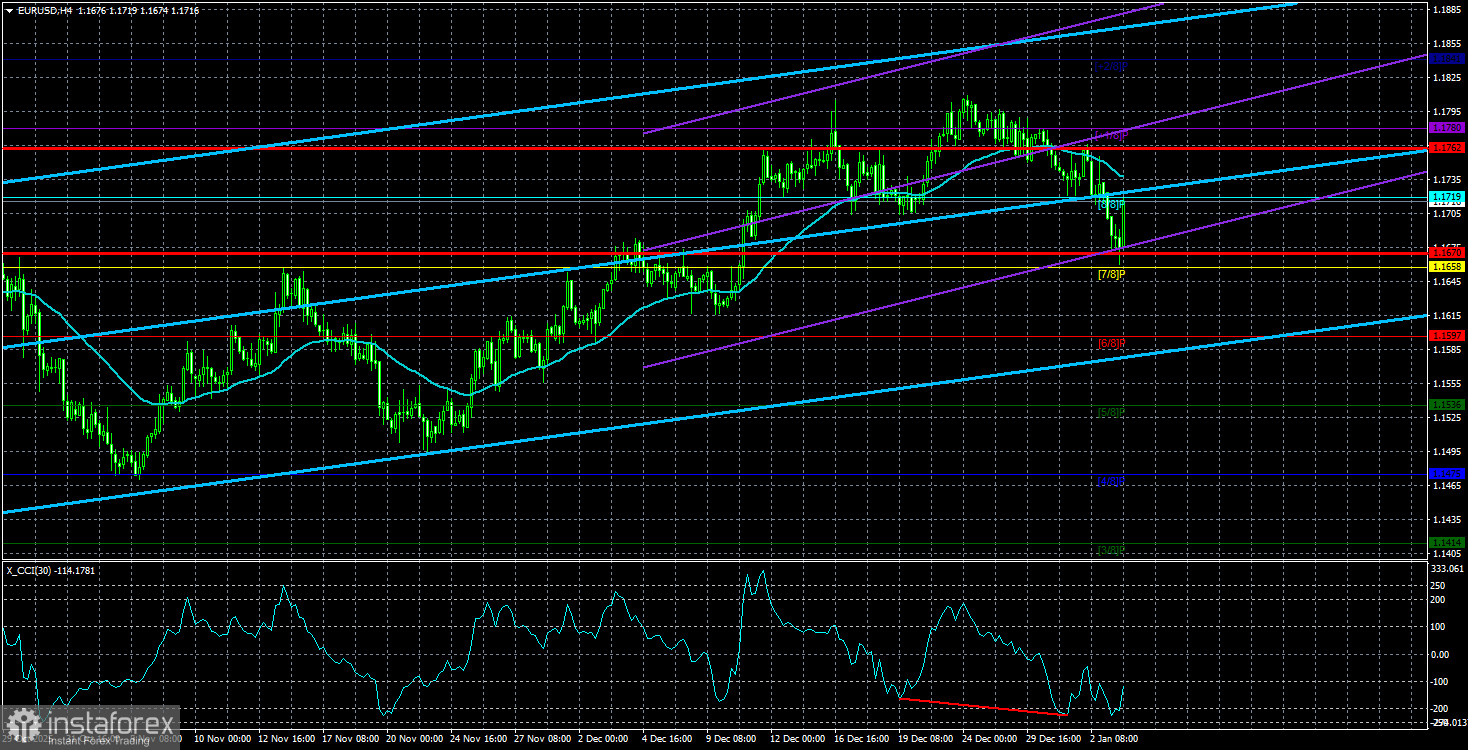
The EUR/USD currency pair did not show any dazzling moves during Monday, although many traders were expecting exactly such a development. On Saturday, Donald Trump ordered the bombing of Venezuela's capital, Caracas, in order to paralyze the functioning of military and government institutions. The attack was required to capture the country's president, Nicolas Maduro, which was successfully accomplished in just five hours. At present, Maduro is already in the United States, where he is expected to stand trial before the "most humane court in the world." Of course, we will not speculate on whether Donald Trump has the right to issue such orders, or what international law, the UN, and various other organizations think about it. In principle, Trump has long demonstrated to the entire world that the law is the law—but there are exceptions. However, the most interesting part lies ahead. Throughout 2025, we said that Trump's policies (without dividing them into individual segments and spheres) were the key reason for the dollar's decline. We warned that 2026 could turn out to be no better than 2025—for the US dollar. And now, before 2026 has even properly begun, Trump has already carried out a military operation to capture the leader of another state and has also made it clear that his own statements from a year ago about the annexation of Greenland were not a joke. This morning, many analysts reported that the dollar would rise on Maduro's detention, as "risk-off sentiment" was growing in the markets and, therefore, demand for the safe-haven dollar would increase. However, we would like to note that, as a rule, the dollar was used as a "safe haven" in cases where the United States was not a participant in a geopolitical conflict. Now the whole world understands that if Washington wants a change of power in any country in the world (except, of course, heavyweights like Russia, the European Union, or China), it will simply carry out another military operation and capture any politician or official. Therefore, the trade war of 2025 may end up looking like "child's play" to the markets. This leaves us with only one question: how should traders treat a currency whose leader and head of state openly adheres no longer to the principles of protectionism, but to outright dictatorship? In our view, the US currency received another heavy blow at the beginning of the year. Yes, on Monday the dollar managed to strengthen slightly, but by the end of the day it had lost all its gains because the ISM business activity index was released—an indicator far more important for the dollar than events in Venezuela. Thus, our forecast and expectations remain unchanged: the decline of the US currency will continue in 2026. At present, the EUR/USD pair has fallen to the Senkou Span B line on the daily timeframe and is still trading within the sideways channel of 1.1400–1.1830. We continue to wait for the market to get tired of playing "tug of war" and finally push the pair out of the flat—naturally, through the upper boundary.

Image

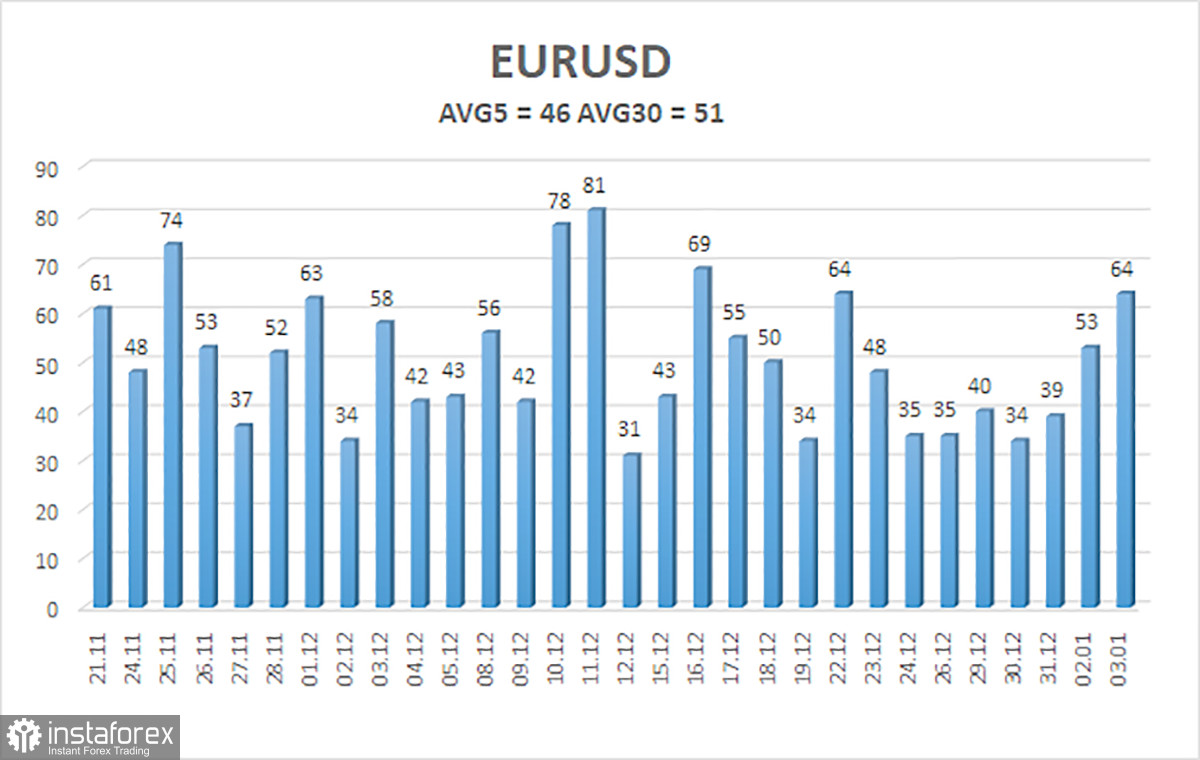
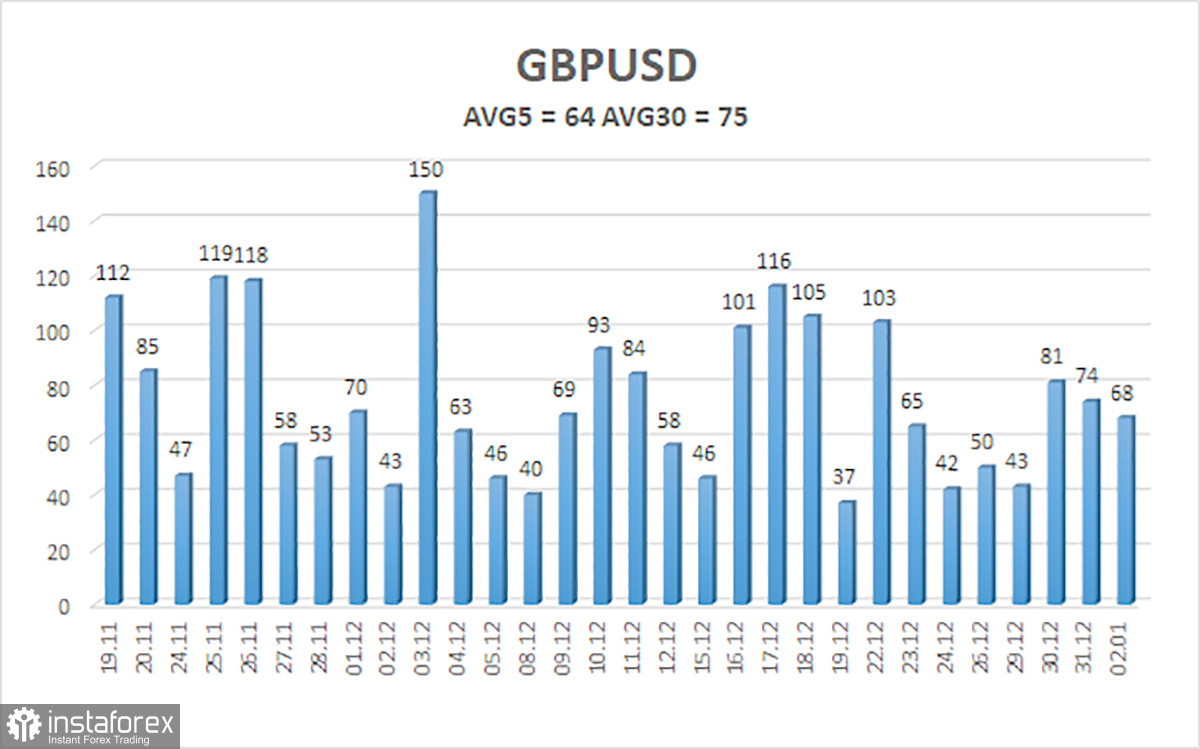
The average volatility of the EUR/USD pair over the last five trading days as of January 6 is 46 points, which is characterized as "low." We expect the pair to move between the levels of 1.1670 and 1.1762 on Tuesday. The higher linear regression channel is turning upward, but in practice the flat market on the daily timeframe is still ongoing. The CCI indicator entered the overbought zone at the beginning of December, but we have already seen a small pullback. Last week, a bullish divergence was formed, pointing to a resumption of the upward trend. Nearest Support Levels: S1 – 1.1658S2 – 1.1597S3 – 1.1536 Nearest Resistance Levels: R1 – 1.1719R2 – 1.1780R3 – 1.1841 Trading Recommendations The EUR/USD pair has consolidated below the moving average, but the upward trend remains intact on all higher timeframes, while a flat market has persisted on the daily timeframe for the sixth consecutive month. The global fundamental backdrop continues to be of great importance for the market, and it remains negative for the dollar. Over the past six months, the dollar has occasionally shown weak growth, but exclusively within the sideways channel. There is no fundamental basis for long-term strengthening. With the price located below the moving average, small short positions may be considered with targets at 1.1670 and 1.1658 on purely technical grounds. Above the moving average, long positions remain relevant with a target of 1.1830 (the upper boundary of the daily flat), which has effectively already been reached. Now the flat needs to end. Explanations to the Illustrations Linear regression channels help determine the current trend. If both are directed in the same direction, the trend is currently strong. The moving average (settings 20,0, smoothed) determines the short-term trend and the direction in which trading should currently be conducted. Murray levels are target levels for movements and corrections. Volatility levels (red lines) represent the likely price channel in which the pair will trade over the next 24 hours, based on current volatility readings. The CCI indicator: when it enters the oversold zone (below ?250) or the overbought zone (above +250), it signals that a trend reversal in the opposite direction is approaching.

Analysis are provided by InstaForex.

Read more: https://ifxpr.com/3N6LpnS
IFX Bella
 
Posts: 560
Joined: Sat Dec 08, 2012 12:39 am

Previous

Return to Forex Brokers