The EUR/USD currency pair traded quite calmly on Monday, as we had warned. The only interesting event scheduled for Monday was the publication of the European Union's industrial production report. This indicator slightly exceeded forecast values, but only in annual terms. Overall, this report can be deemed interesting but not important. Accordingly, the reaction to it was minimal. Nevertheless, the euro is rising, and what lies ahead for both the euro and the dollar this week remains a mystery. It is worth noting that this week is significant not only because of the meetings of the European Central Bank and the Bank of England, but also because of the publication of regular reports released around the same dates each month. This week will feature "overtime" reports—not trivial indicators, but metrics that the market has been anticipating since early October. Therefore, alongside important events such as central bank meetings in the Eurozone and the UK, we can expect crucial data on the US labor market, unemployment, and inflation. Additionally, there are consumer sentiment indices from the University of Michigan, service and manufacturing sector activity indices, and retail sales data. There will be a substantial amount of data, which means the pair could experience significant fluctuations in various directions this week. However, the market is already beginning to quietly "glimpse" into 2026. Regardless of the movements we may observe in the remaining two weeks of 2025, everyone is wondering whether the depreciation of the US currency will continue next year. It is essential to remember that the primary cause of the dollar's sharp decline this year is Donald Trump, not the Federal Reserve's or the ECB's monetary policy. Trump initiated a global trade war, enacted a series of laws that fundamentally reshape the US economy, waged war with the Fed, and is doing everything possible to devalue the dollar to improve the trade balance. These factors have been at play throughout 2025. Now, try to answer the question: what has changed by the end of 2025? The trade war continues, and no one knows what tariffs Trump will introduce tomorrow. November has passed without any reports from the Supreme Court regarding the cancellation of trade tariffs. The conflict with the Fed will persist until Trump establishes control over this organization and lowers the key interest rate to acceptable levels through his "appointees." Trump can continue to enact absurd laws, as he does not even require Congressional approval – both chambers are Republican. According to the White House, the US dollar is still too strong, which is why American exports are growing weakly or not at all. Everything suggests that the "Trump saga" will continue into 2026. Consequently, the dollar should only be expected to decline.
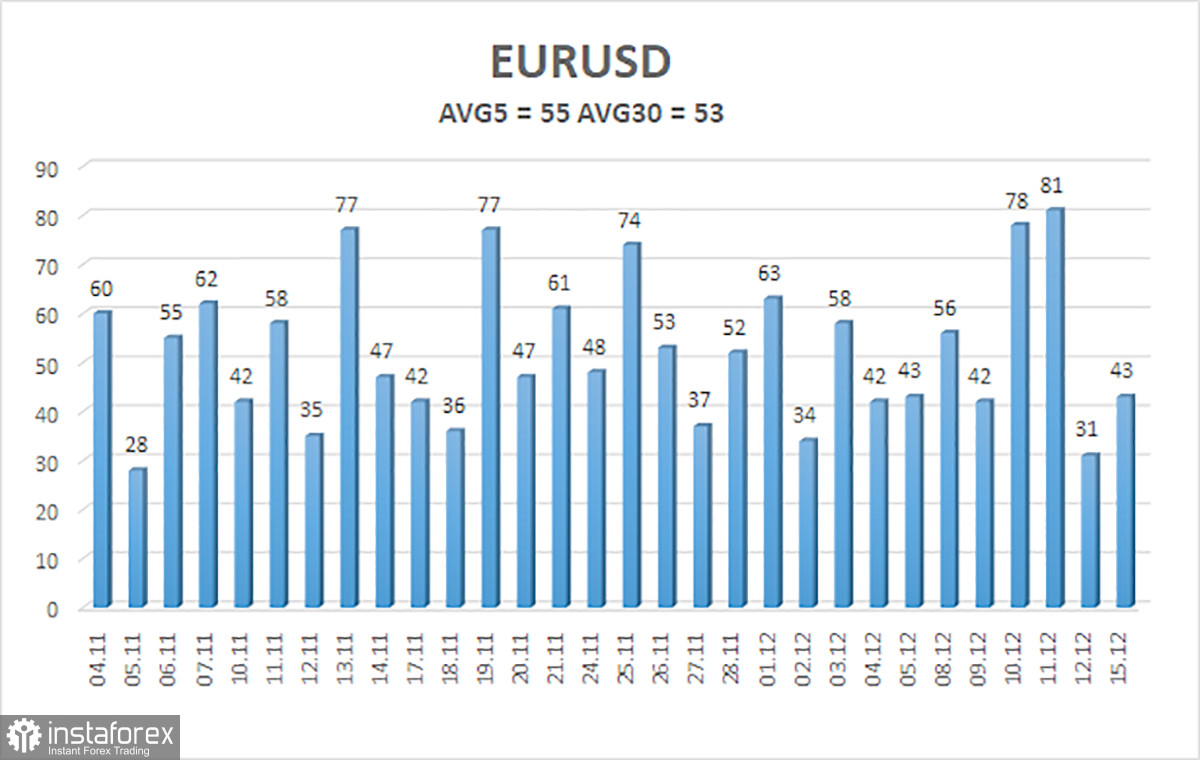
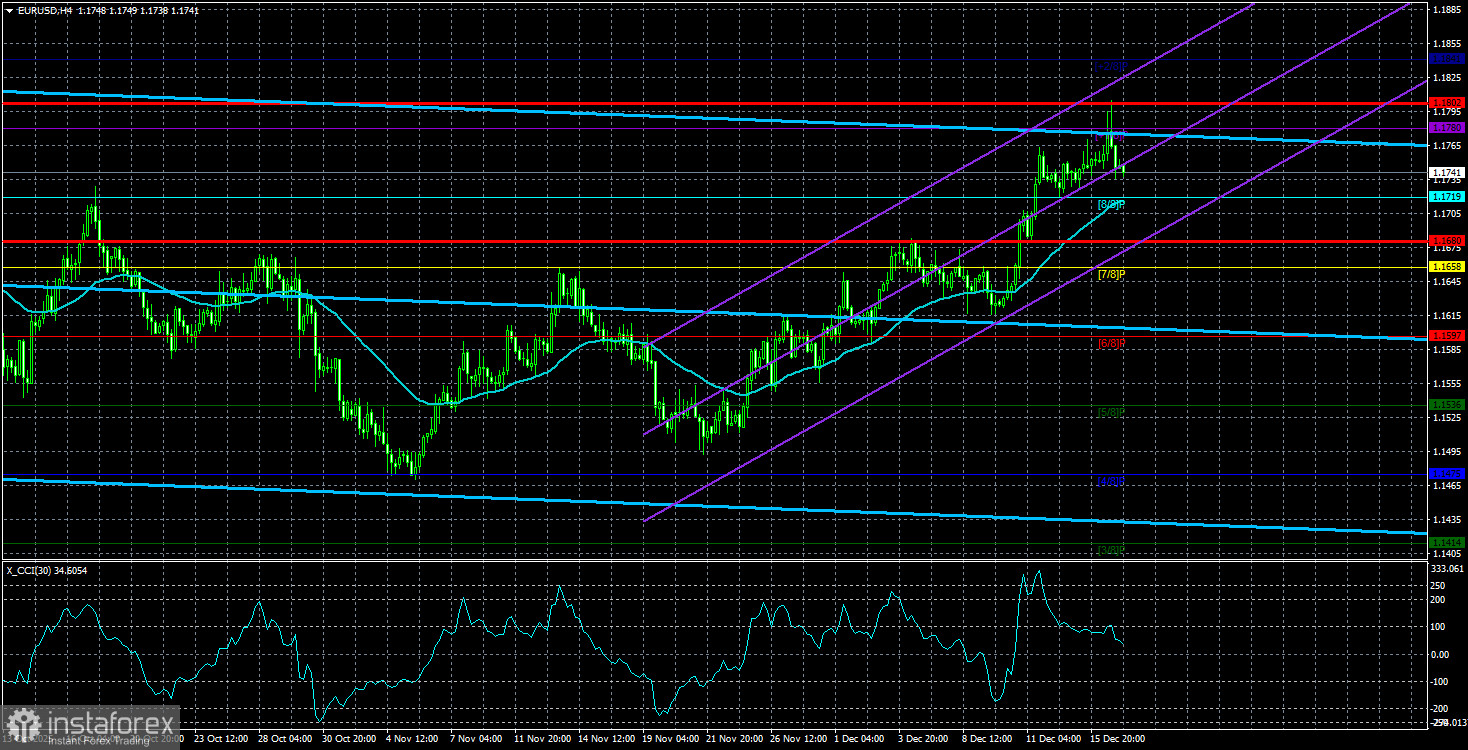
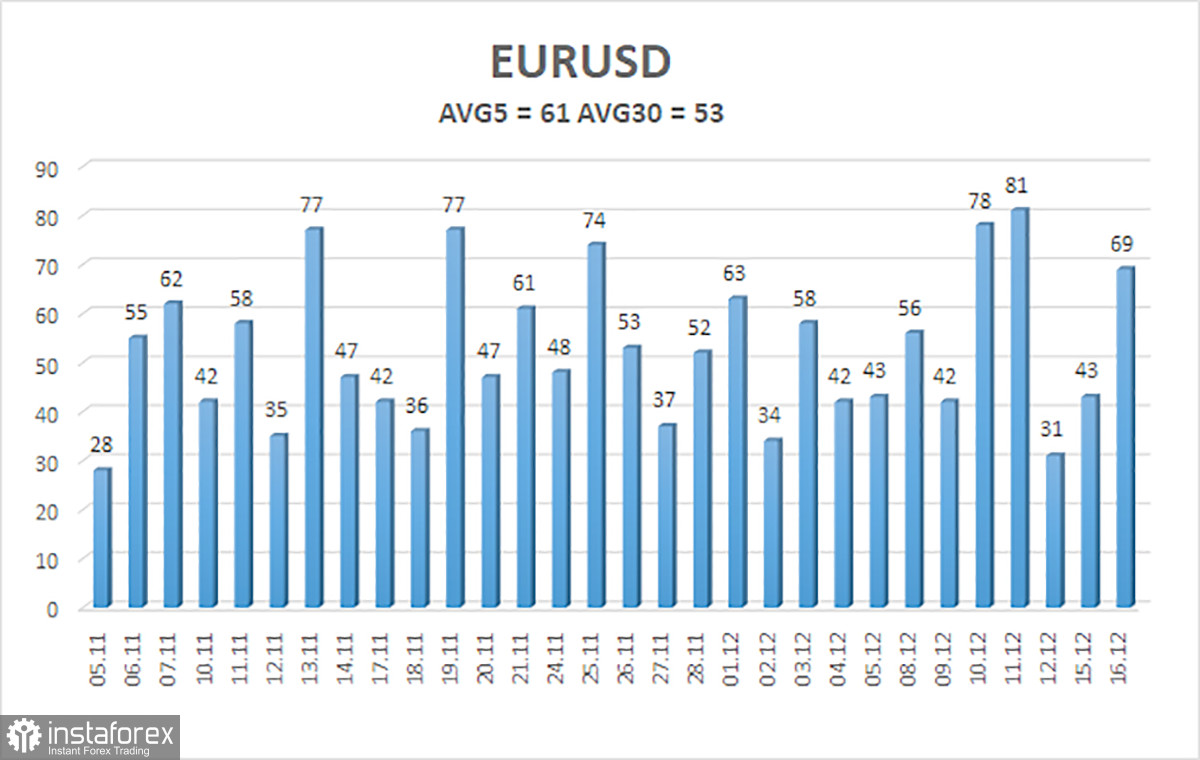
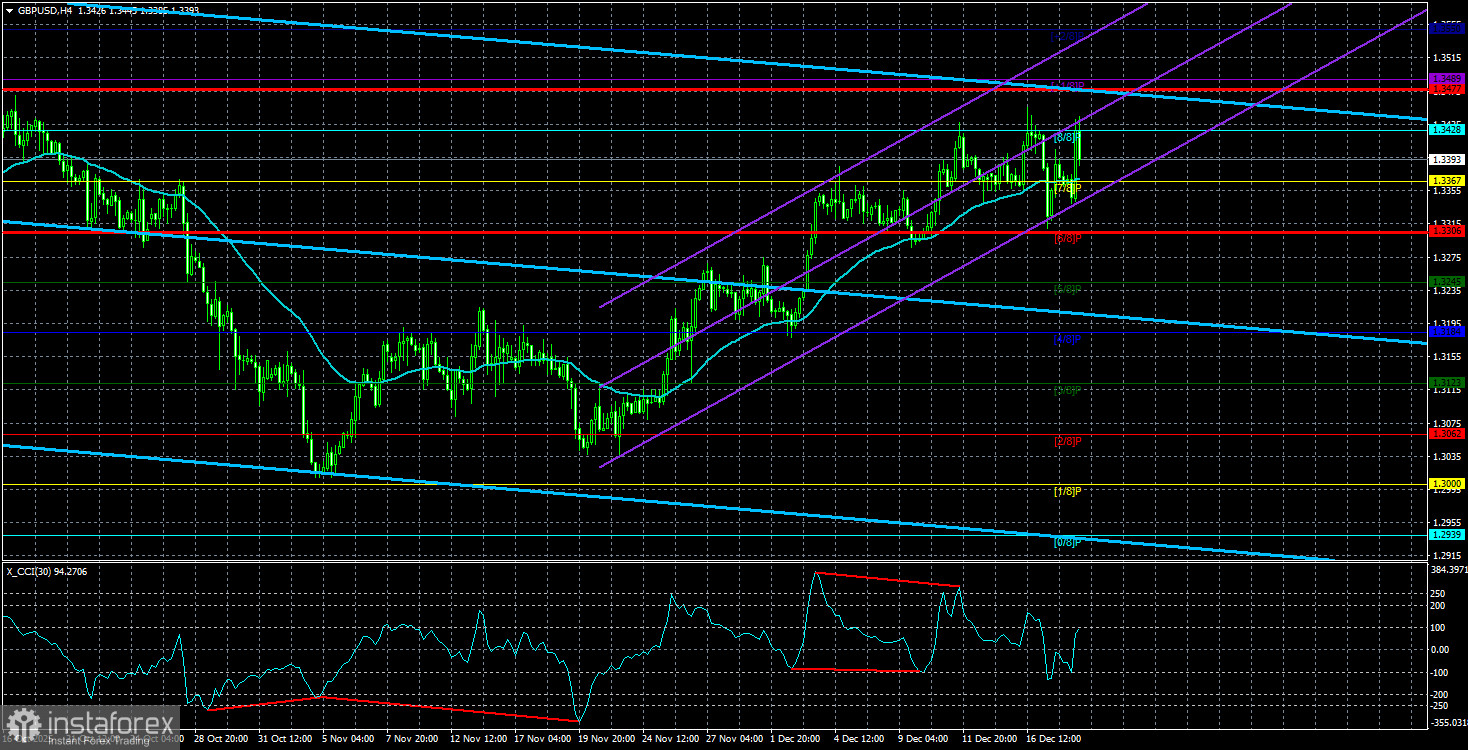
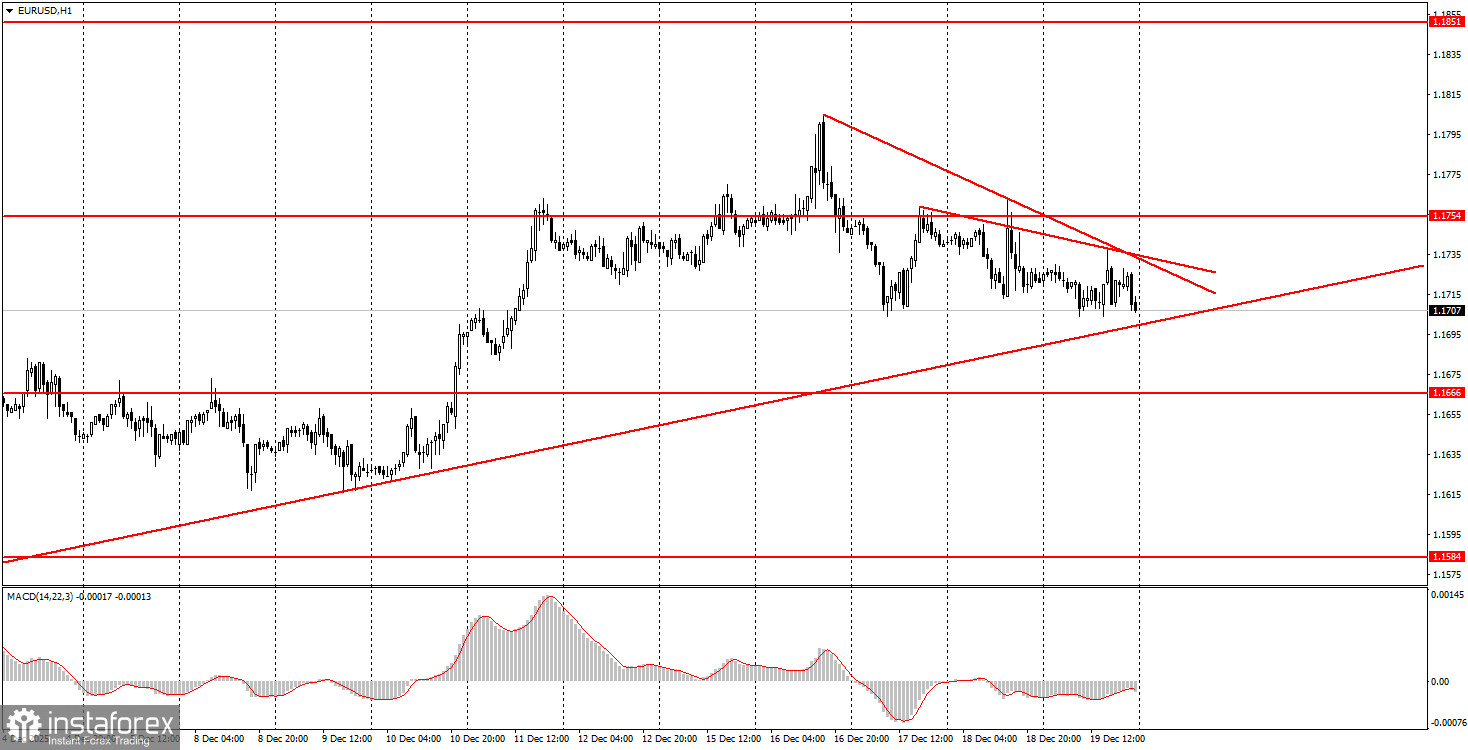
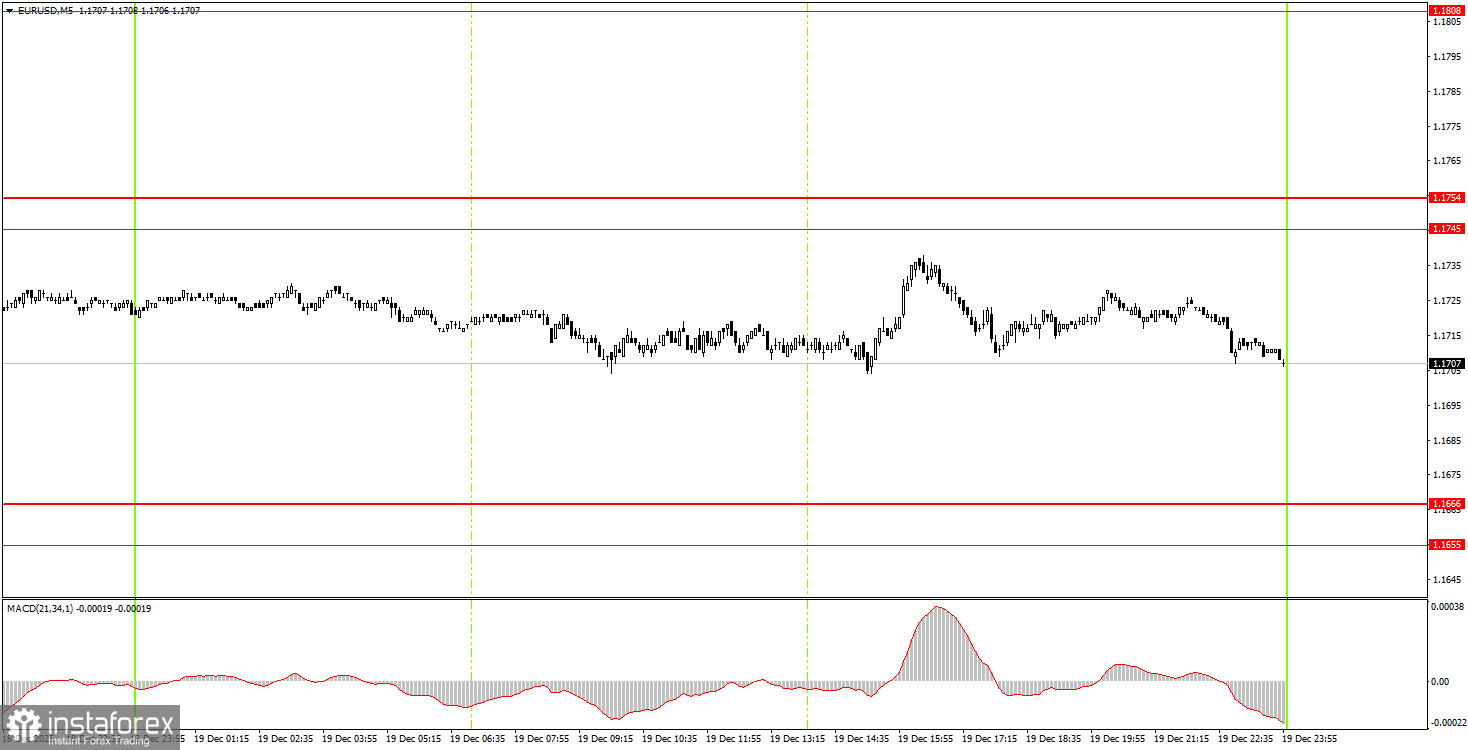
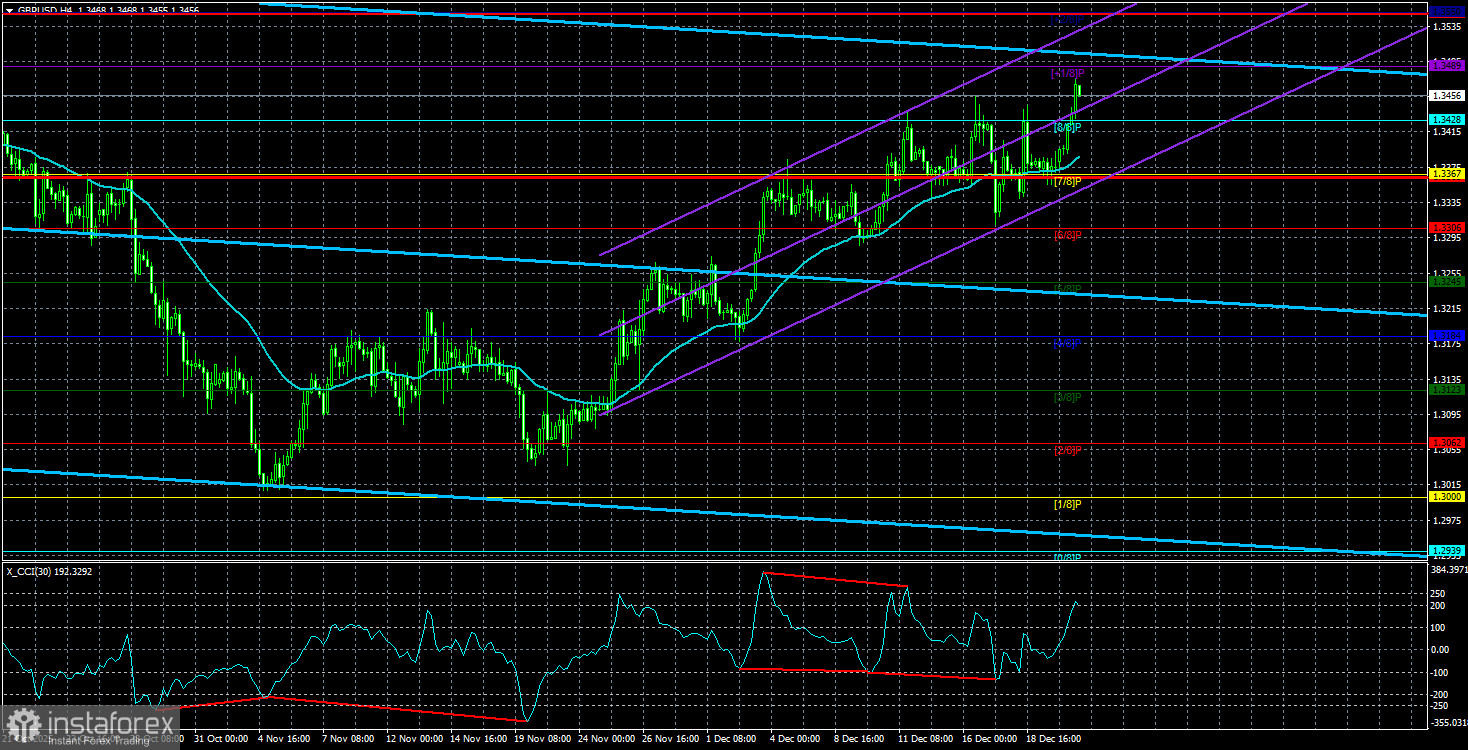
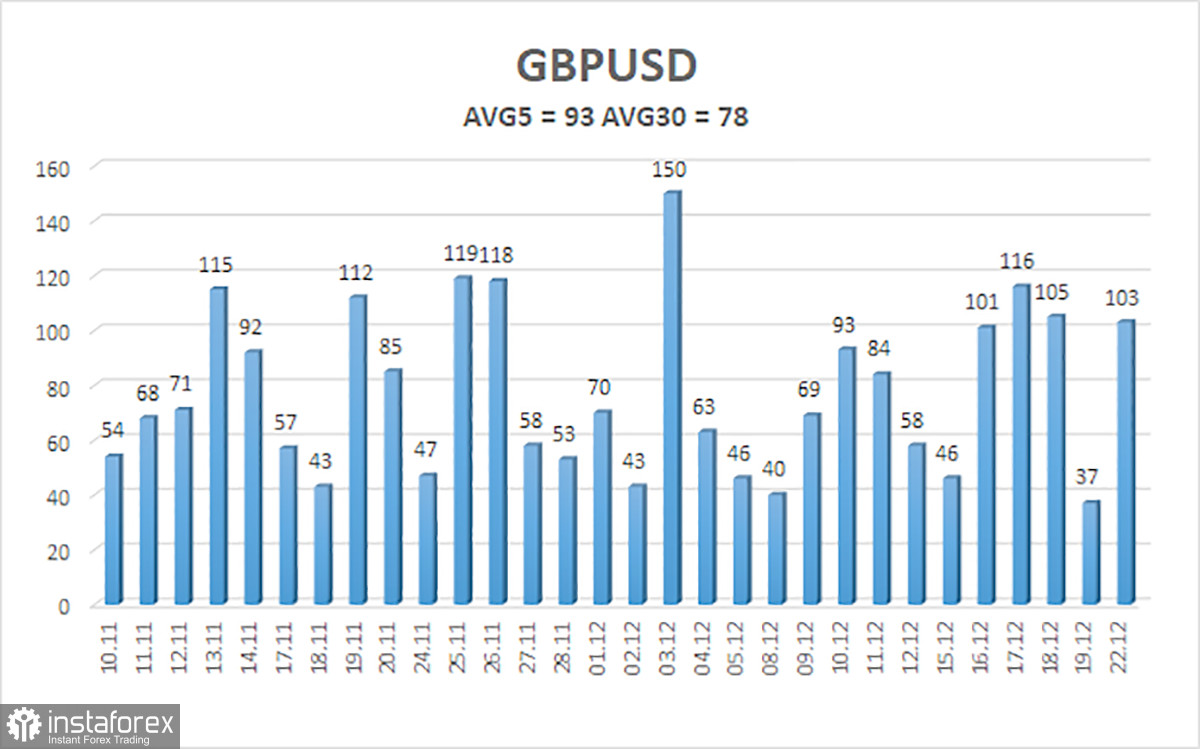
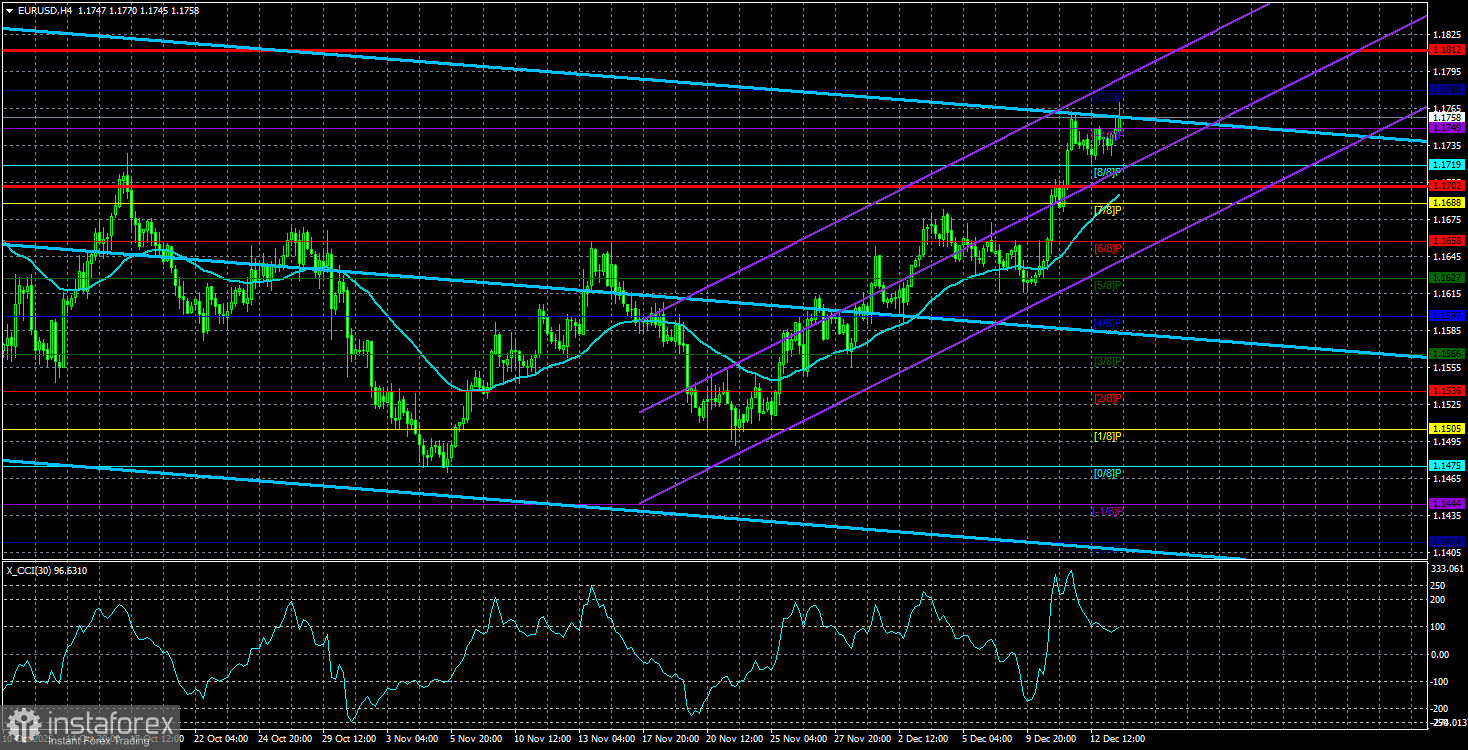
The average volatility of the EUR/USD currency pair over the last five trading days, as of December 16, is 55 pips, which is considered "average." We expect the pair to trade between 1.1702 and 1.1812 on Tuesday. The upper linear regression channel is directed downward, signaling a bearish trend, but in fact, a range-bound situation continues on the daily timeframe. The CCI indicator entered the oversold area twice in October, but last week it visited the overbought area. A downward pullback is possible. Nearest Support Levels: S1 – 1.1749 S2 – 1.1719 S3 – 1.1688 Nearest Resistance Levels: R1 – 1.1780 Trading Recommendations: The EUR/USD pair is positioned above the moving average line, maintaining an upward trend on all higher timeframes, while the daily timeframe has been in a range for several months. The global fundamental backdrop remains of immense importance to the market and remains negative for the dollar. In the past six months, the dollar has occasionally shown weak growth, but only within the bounds of a sideways channel. There is no fundamental basis for long-term strengthening. If the price is below the moving average, small short positions can be considered, targeting 1.1658 and 1.1627 on purely technical grounds. Above the moving average line, long positions remain relevant with targets at 1.1798 and 1.1830 (the upper line of the flat range on the daily timeframe). Illustration Explanations: Linear Regression Channels help to determine the current trend. If both are directed in one way, it indicates that the trend is strong. Moving Average Line (settings 20,0, smoothed) indicates the short-term trend and the direction in which trading should currently be conducted. Murray Levels – target levels for movements and corrections. Volatility Levels (red lines) – the likely price channel in which the pair will operate in the coming day, based on current volatility indicators. CCI Indicator – its entry into the oversold area (below -250) or overbought area (above +250) signifies an impending trend reversal in the opposite direction.
Analysis are provided by InstaForex.
Read more: https://ifxpr.com/3XXpku6