Instaforex Analysis

Forex broker related topics and discussions

Re: Instaforex Analysis

Postby IFX Bella » Mon Jul 15, 2024 3:53 am

Forex Analysis & Reviews: Forecast for EUR/USD on July 15, 2024

Image

EUR/USD By the end of the week, the euro managed to reach the target level of 1.0905, which is the upper boundary of the descending price channel on the weekly timeframe.

The divergence with the Marlin oscillator suggests a reversal, but once again, a gap is interfering. This gap doesn't significantly affect the technical pattern of the reversal because it can be recouped without any noticeable impact. If the price manages to consolidate above 1.0905, the euro will continue to rise to 1.0964 or even higher.

A double divergence has formed on the 4-hour chart. Recouping the gap may not even disrupt the divergence. The first sign of a reversal is when the price moves below the Kijun-sen line (1.0853). This will likely happen no sooner than tomorrow.

Analysis are provided by InstaForex.

Read more: https://ifxpr.com/3W5mwtf
IFX Bella
 
Posts: 384
Joined: Sat Dec 08, 2012 12:39 am

Re: Instaforex Analysis

Postby IFX Bella » Tue Jul 16, 2024 5:26 am

Forex Analysis & Reviews: Hot forecast for EUR/USD on July 16, 2024

Image

Yesterday, the dollar was stable amid mixed economic reports and statements of the central bank officials. On the one hand, the eurozone industrial production data, the rate of decline of which slowed down from -3.1% to -2.9%, should have lifted the dollar. After all, despite the slowdown, it was expected to rise from -3.0% to -2.0%. But this was offset by Federal Reserve Chief Jerome Powell's statement that the inflationary dynamics in the United States indicates a slowdown in consumer price growth to the target level of 2.0%. In other words, the head of the Fed almost directly stated that the rate cut is coming into view. And naturally, this weighs on the dollar. Today, the market can focus on the U.S. retail sales report, the growth rate of which should slow down from 2.3% to 2.1%. So the doll

During the upward cycle, locally EUR/USD found itself at the values of the beginning of spring, which indicates the prevailing interest in long positions. On the 4-hour chart, the RSI technical indicator is hovering in the upper area of 50/70, which suggests that the euro may rise further. On the same chart, the Alligator's MAs are headed upwards, which reflects the quote's movement. Outlook Keeping the price above the level of 1.0900 may lead to an increase in the volume of long positions. In this scenario, the euro could move towards the resistance level of 1.1000. Otherwise, the area of 1.0900 will act as resistance, which will lead to a temporary stagnation or a pullback. The complex indicator analysis unveiled that in the short-term and intraday periods, indicators are providing an upward signal.


Analysis are provided by InstaForex.


Read more: https://www.instaforex.eu/forex_analysis/382297
IFX Bella
 
Posts: 384
Joined: Sat Dec 08, 2012 12:39 am

Re: Instaforex Analysis

Postby IFX Bella » Wed Jul 17, 2024 5:22 am

Forex Analysis & Reviews: Hot forecast for EUR/USD on July 17, 2024

Image


The dollar was steady despite relatively good data on retail sales. In fact, their growth rate in the United States slowed from 2.6% to 2.3%. The thing is that the growth rate was expected to slow down from 2.3% to 2.1%. So in theory, the dollar should have strengthened somewhat. However, the general sentiment on the dollar is quite negative, as investors expect the Federal Reserve to start lowering its interest rate soon. Thus, the retail sales data simply supported the dollar, preventing it from falling further. Apparently, today we expect a repeat of yesterday's scenario. Sentiments about the Fed's monetary policy still weighs on the dollar. It will be supported by the industrial production data, whose growth rate in the United States should accelerate from 0.1% to 0.4%. But the eurozone inflation data as a whole can not be considered, as the final data are published, designed only to confirm the preliminary estimates, the market has already taken into account.

EUR/USD is moving around the resistance level of 1.0900, which indicates that the bullish sentiment is still in force. On the 4-hour chart, the RSI technical indicator is hovering in the upper area of 50/70, which suggests that the euro may rise further. On the same chart, the Alligator's MAs are headed upwards, which reflects the quote's movement. Outlook Based on the absence of a full-scale correction, we can conclude that there's a high volume of long positions on the euro. Rising above the level of 1.0900 may lead to a new round of growth, where buyers will face the psychological level of 1.1000. As an alternative scenario, traders are considering movement along the level of 1.0900. The complex indicator analysis unveiled that in the short-term and intraday periods, indicators are providing an upward signal.


Analysis are provided by InstaForex.

Read more: https://ifxpr.com/3Y7Vbtc
IFX Bella
 
Posts: 384
Joined: Sat Dec 08, 2012 12:39 am

Re: Instaforex Analysis

Postby IFX Bella » Thu Jul 18, 2024 3:33 am

Forex Analysis & Reviews: Hot forecast for EUR/USD on July 18, 2024

Image

Despite excellent industrial production data, with growth rates in the United States accelerating from 0.3% to 1.6%, the dollar still weakened somewhat. What's even more intriguing is the fact that this happened long before the industrial production data was published. And even before the final inflation data was released in the eurozone. Although they certainly couldn't have influenced anything, as they completely matched estimates. Apparently, this is how the market prepares for the Federal Reserve drawing closer to an interest rate cut. The market is confident that this will happen as early as September. However, today, market participants will focus on the European Central Bank's board meeting. And although the ECB's interest rates are expected to remain unchanged, given the inflation dynamics and extremely weak macro data, ECB President Christine Lagarde may still hint at another rate cut. Thus, indicating that the disparity in interest rates between the dollar and the euro could grow even more in favor of the greenback. As a result, the dollar could retreat to the levels seen at the start of yesterday's trading.

As the volume of long positions rose when EUR/USD settled above the 1.0900 level, the price moved towards the main psychological level of 1.1000. On the 4-hour chart, the RSI locally reached the overbought zone, but it did not hit any of the critical levels. For this reason, buying volumes still have the potential to rise. On the same chart, the Alligator's MAs are headed upwards, which reflects the quote's movement. Outlook In case the pair rises further, the quote may reach the psychological level, but it is important to take note of the euro's overbought status. Thus, the pair could pull back or become stagnant within the boundaries of the psychological level. An increase in buying volumes may take place after the price settles above the 1.1050 level. The complex indicator analysis unveiled that in the short-term and intraday periods, indicators are providing an upward signal.

Analysis are provided by InstaForex.


Read more: https://ifxpr.com/4f55FzB
IFX Bella
 
Posts: 384
Joined: Sat Dec 08, 2012 12:39 am

Re: Instaforex Analysis

Postby IFX Bella » Fri Jul 19, 2024 3:36 am

Forex Analysis & Reviews: Hot forecast for EUR/USD on July 19, 2024

Image


The European Central Bank was widely expected to keep interest rates unchanged. What came as a surprise were the Bank's extremely pessimistic assessments of the eurozone economy. This suggests not just further easing of monetary policy, but possibly a more aggressive rate cut. Moreover, ECB President Christine Lagarde said that the next interest-rate meeting is "wide open", hinting that another cut is possible. So, it should not be surprising that the euro actively fell on these remarks. Nevertheless, it is likely to be temporary. The market has long been anticipating the ECB's rate cuts. The main focus now is the upcoming rate cut by the Federal Reserve. Therefore, once the media starts discussing this topic more actively, the euro will likely rise again. It is quite possible that within just a couple of days, the market will return to the levels seen at the start of yesterday's trading.

The volume of long positions on the EUR/USD pair decreased within the lower range of the psychological level of 1.0950/1.1000. As a result, a pullback occurred, causing the price to drop below the 1.0900 mark. The RSI dropped below the average level of 50 in the 4-hour time frame during the price pullback, indicating an increase in the volume of short positions on the euro. Regarding the Alligator indicator in the same time frame, two out of three moving average lines are intertwined, indicating a slowdown in the upward cycle. However, these are initial signs of a slowdown, which do not change the overall trend. Outlook If the price settles below 1.0900 by the end of the week, the pair may enter a corrective phase. Otherwise, the euro's local weakness may benefit the bulls, leading to a new stage of growth. Complex indicator analysis points to a corrective move in the short-term and intraday time frames.


Analysis are provided by InstaForex.

Read more: https://ifxpr.com/3SdOMZC
IFX Bella
 
Posts: 384
Joined: Sat Dec 08, 2012 12:39 am

Re: Instaforex Analysis

Postby IFX Bella » Mon Jul 22, 2024 5:20 am

Forex Analysis & Reviews: Indicator analysis: Daily review of GBP/USD on July 22, 2024

Image

Trend Analysis (Fig. 1) Today, GBP/USD may start moving upward from the 1.2908 level (the close of Friday's daily candle) with a target of 1.2941 – the 23.6% retracement level (red dotted line). The price will likely rise from this level with a target of 1.2980 – the 14.6% retracement level (red dotted line).

Fig. 1 (daily chart) Comprehensive Analysis: Indicator Analysis – Up; Fibonacci Levels – Up; Volumes – Up; Candlestick Analysis – Down; Trend Analysis – Up; Bollinger Bands – Up; Weekly Chart – Up. General Conclusion: Today, GBP/USD may start moving upward from the 1.2908 level (the close of Friday's daily candle) with a target of 1.2941 – the 23.6% retracement level (red dotted line). The price will likely rise from this level with a target of 1.2980 – the 14.6% retracement level (red dotted line). Alternative Scenario: The pair may attempt to continue the downward movement from the level of 1.2908 (the close of Friday's daily candle) with a target of 1.2820 – the 8 EMA (blue thin line). The price will likely rise from this line with a target of 1.2980 – the 14.6% retracement level (blue dotted line).

Analysis are provided by InstaForex.

Read more: https://ifxpr.com/3Wm0V06
IFX Bella
 
Posts: 384
Joined: Sat Dec 08, 2012 12:39 am

Re: Instaforex Analysis

Postby IFX Bella » Tue Jul 23, 2024 4:46 am

Forex Analysis & Reviews: Technical Analysis of Intraday Price Movement of NZD/USD Commodity Currency Pairs, Tuesday July 23, 2024.

Image

With the appearance of deviations between price movements and the MACD Histogram indicator on the 4-hour chart of the NZD/USD commodity currency pair, in the near future there will be a strengthening correction in the Kiwi even though currently the bias is still weak, which is confirmed by the price movement which is below the EMA 20 & EMA 50, but as long as the strengthening correction does not broken above the 0.6061 level, NZD/USD will have the potential to weaken again to the 0.5930 level as the main target and if momentum and volatility support it, NZD/USD will fall to the 0.5839 level.

Analysis are provided by InstaForex.

Read more: https://ifxpr.com/4cSfxLF
IFX Bella
 
Posts: 384
Joined: Sat Dec 08, 2012 12:39 am

Re: Instaforex Analysis

Postby IFX Bella » Wed Jul 24, 2024 3:30 am

Forex Analysis & Reviews: Technical Analysis of Intraday Price Movement of GBP/USD Main Currency Pairs, Wednesday July 24, 2024.

Image

The cable on the 4-hour chart is still in a bullish condition where this condition is confirmed by the position of the EMA 50 which is still above the EMA 200 (Golden Cross). However, currently there is a weakening correction and has the potential to bring GBP/USD to the level of the 1.2845-1.2829 area. However, as long as the downward correction does not broken below the 1.2775 level, GBP/USD will strengthen again because this is confirmed by the appearance of deviations between price movements and the MACD Histogram indicator and the existence of a Failing Wedge pattern. where based on these two indicators, GBP/USD has the potential to appreciate stronger to the level of 1.2941 and if momentum and volatility support it, GBP/USD will continue its strengthening to the level of 1.3043.

Analysis are provided by InstaForex.

Read more: https://ifxpr.com/3YhvNRR
IFX Bella
 
Posts: 384
Joined: Sat Dec 08, 2012 12:39 am

Re: Instaforex Analysis

Postby IFX Bella » Thu Jul 25, 2024 4:55 am

Forex Analysis & Reviews: Hot forecast for EUR/USD on July 25, 2024

Image

The forex market continues to tread water despite the release of economic reports. According to preliminary assessments, European business activity indices have all declined, while only the manufacturing sector's business activity index showed a decrease in the US. Conversely, the composite index and the services PMI data showed growth and exceeded forecasts. Nevertheless, this had no impact on the situation. The weak eurozone data only prevented the dollar from falling. Almost simultaneously, corporate media began promoting the idea of a rate cut at the upcoming Federal Reserve meeting in July. This idea may gain traction and pressure the market, contributing to the dollar's weakness. Considering that today's macro data will have a minor impact, as changes in unemployment claims are expected to be purely symbolic, the market will likely gradually move towards pushing for the dollar's decline.

EUR/USD is in a corrective phase, trading from the lower area of the psychological level 1.0950/1.1000. As a result, the quote has dropped more than 100 pips, which fits within the cyclical component of the upward trend. On the 4-hour chart, the RSI indicator is moving in the lower area of the 30/50 range. However, it touched the oversold level, indicating an excessive volume of short positions in the euro. During the same time frame, the Alligator's MAs point downwards, aligning with the corrective cycle's direction. Outlook The euro may reach the 1.0800 level if the corrective phase remains intact. However, based on the technical signs of the euro's oversold conditions in the short term, selling volumes may eventually fall, which, in theory, will lead to the end of the corrective cycle. In terms of complex indicator analysis, the volume of long positions may likely rise in the short term. Meanwhile, the bearish bias persists in the intraday period.

Analysis are provided by InstaForex.

Read more: https://ifxpr.com/4dgwTl3
IFX Bella
 
Posts: 384
Joined: Sat Dec 08, 2012 12:39 am

Re: Instaforex Analysis

Postby IFX Bella » Fri Jul 26, 2024 4:35 am

Forex Analysis & Reviews: Hot forecast for EUR/USD on July 26, 2024

Image

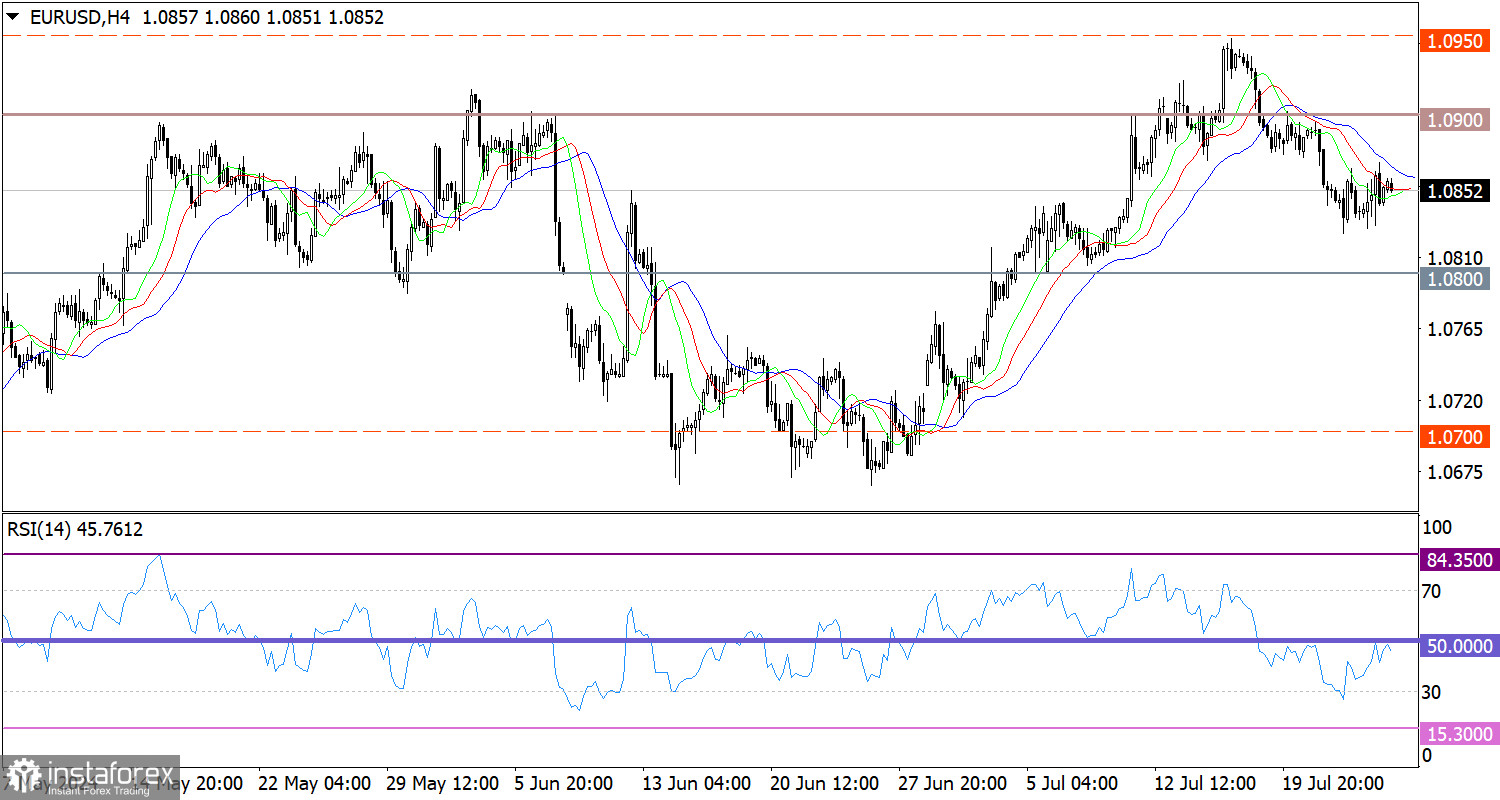
The situation in the market remains unchanged, and in general, the changes have been purely superficial for the entire week. This is partly due to an almost empty economic calendar. On the other hand, after the sharp increase in political uncertainty in the United States over the past weekend, following Joe Biden's announcement of his withdrawal from the election race, the situation had noticeably become more stable by Monday evening. This also contributed to the normalization of the currency market. Moreover, while at the beginning of the week, American media were trying to hype the potential for an interest rate cut this month, by mid-week, it seemed that everyone had forgotten about it. It appears that nothing will change today either, especially with the Federal Open Market Committee meeting approaching in the middle of next week. The media coverage will likely intensify on Monday, with countless predictions and discussions about the possibility of interest rate cuts.

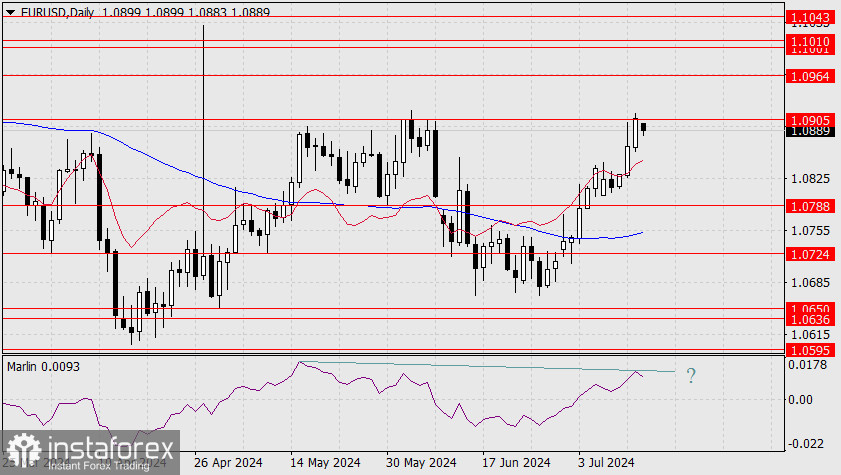
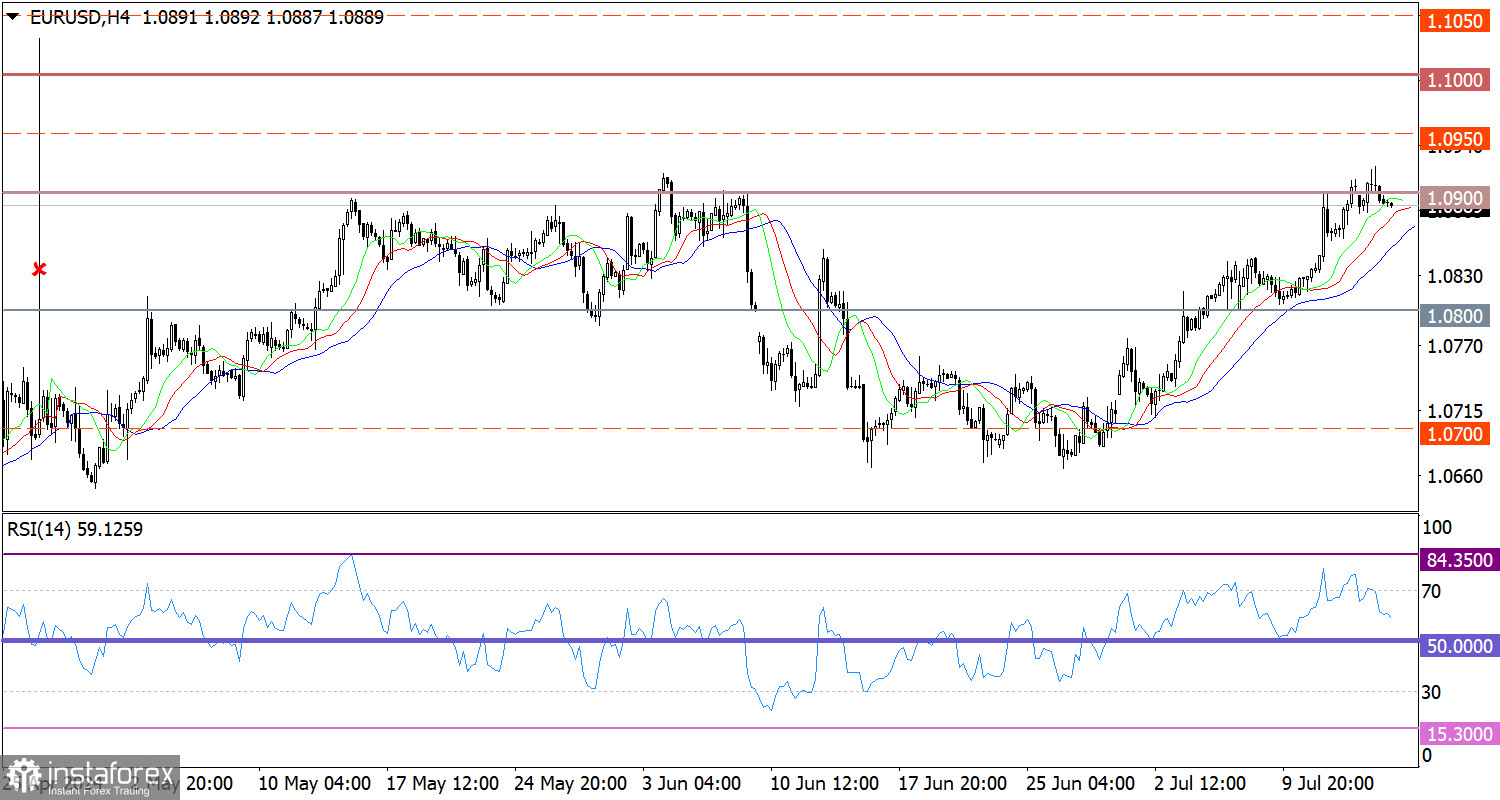
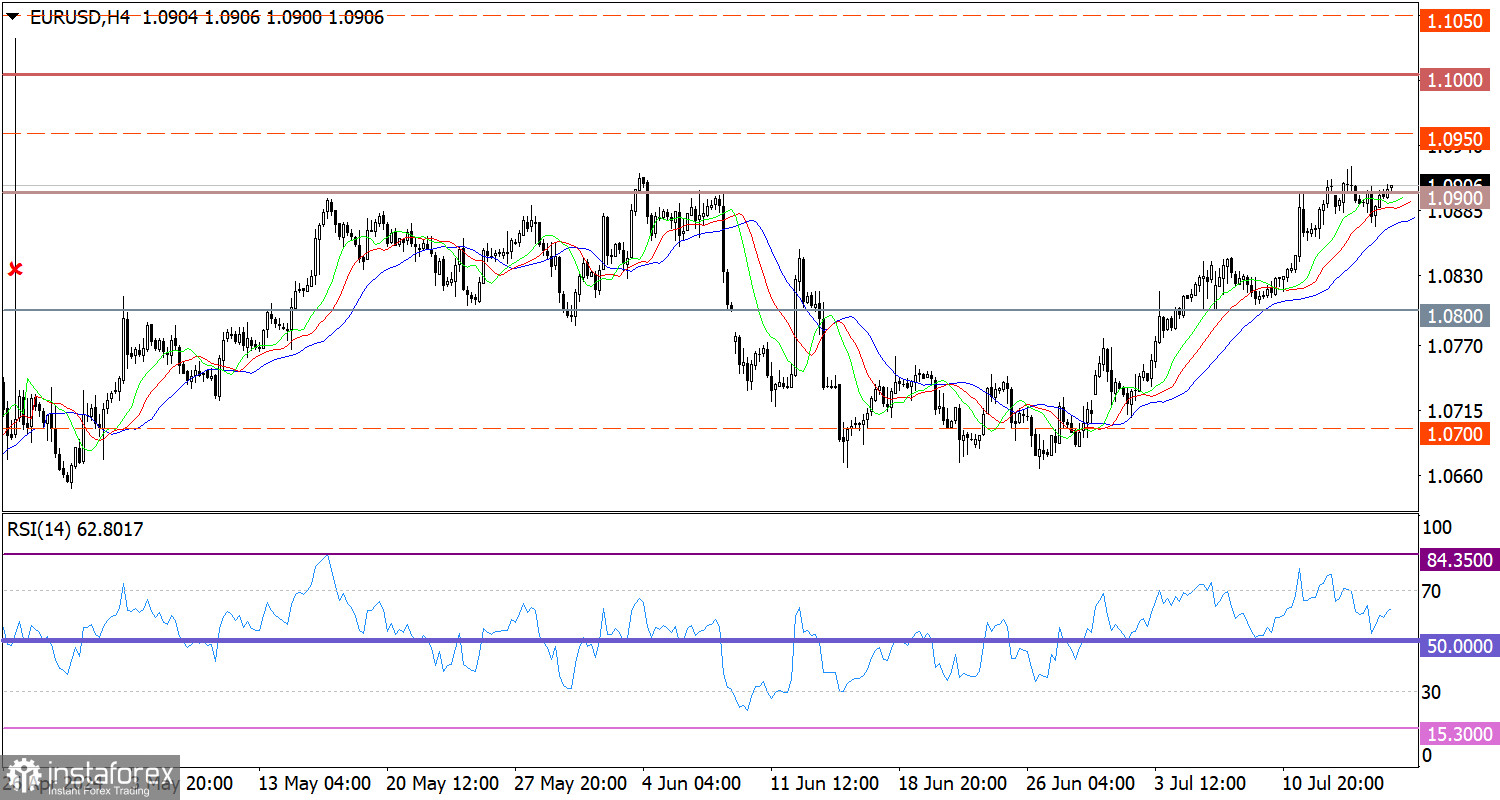
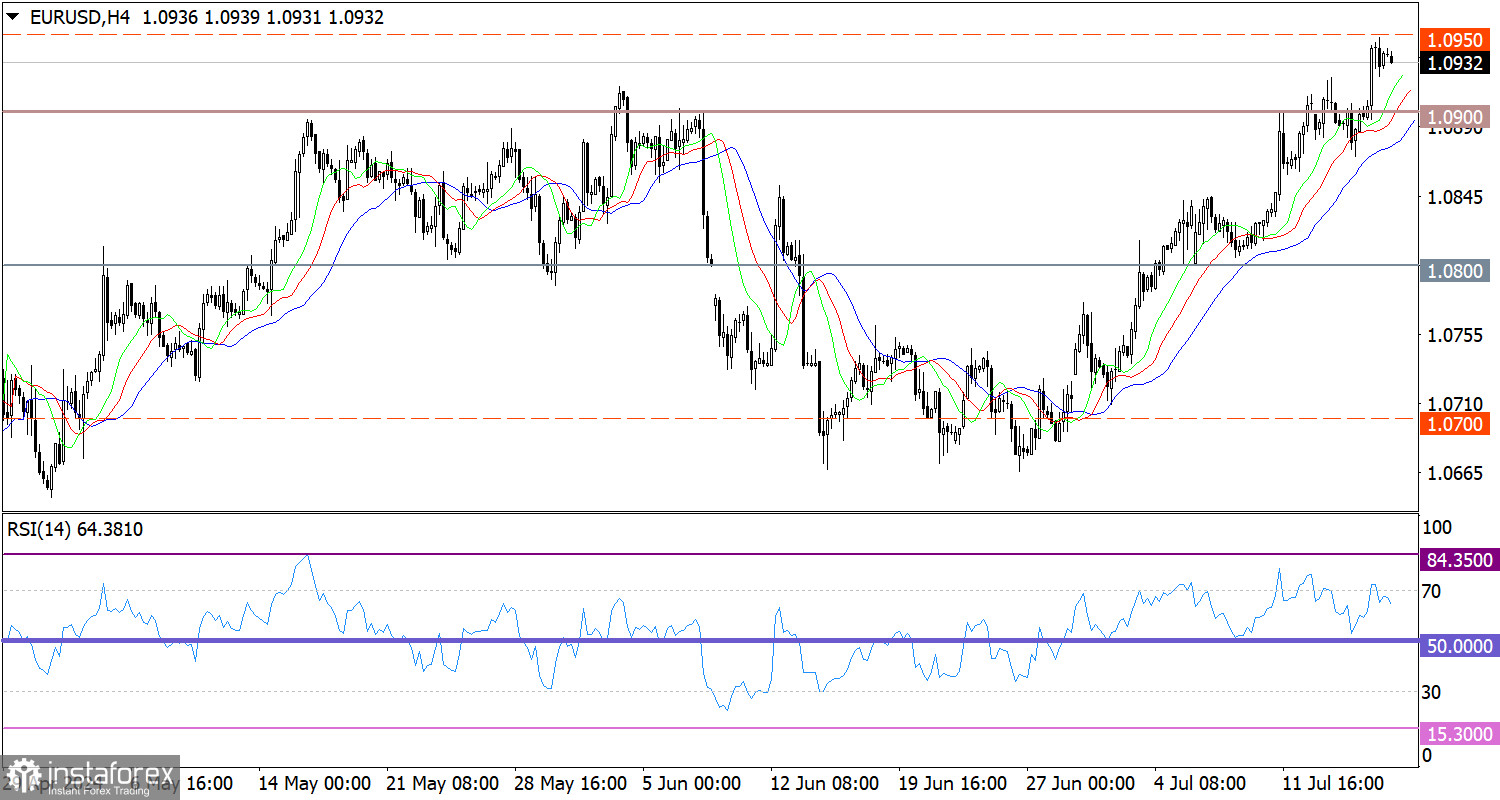
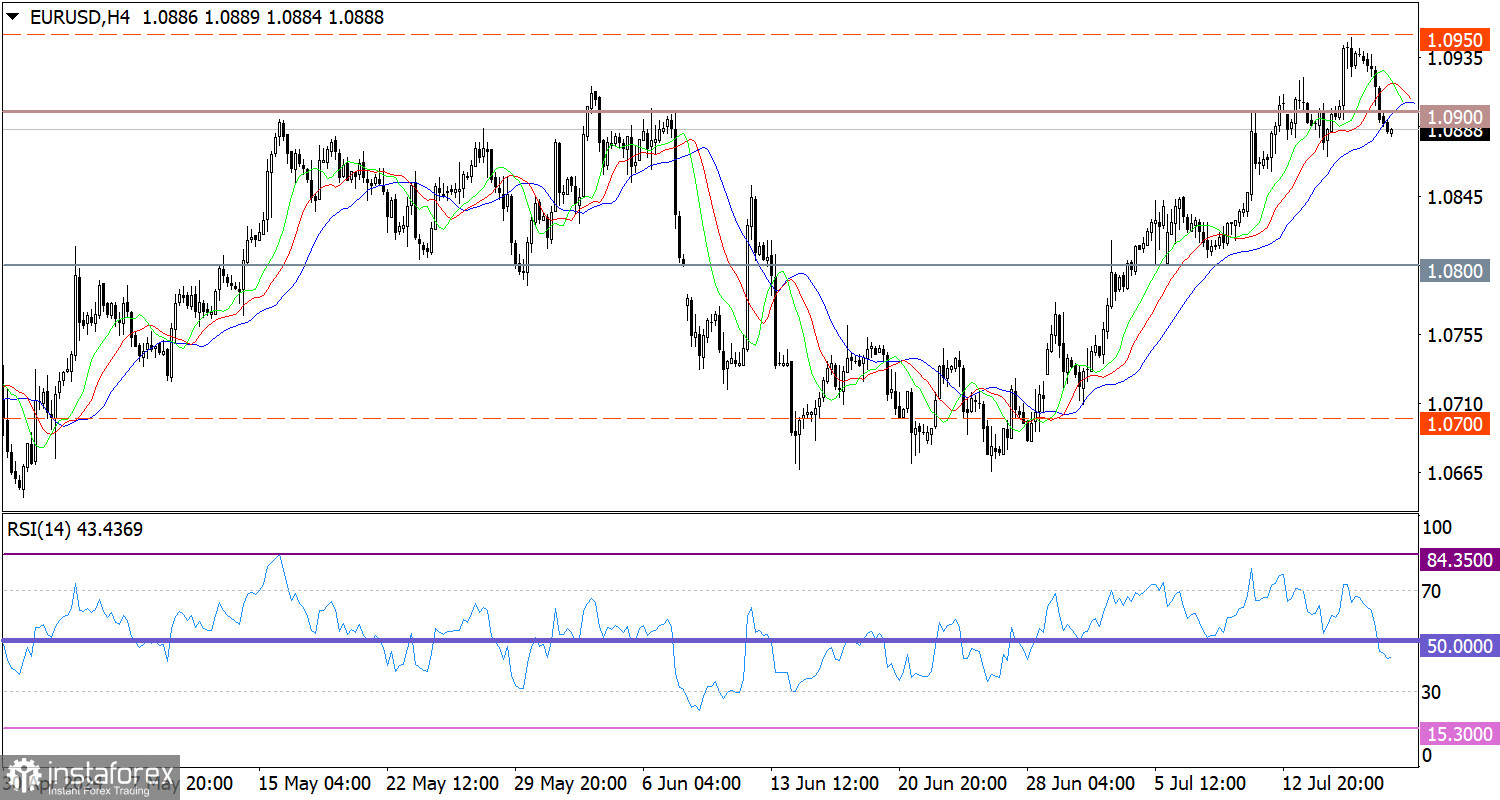
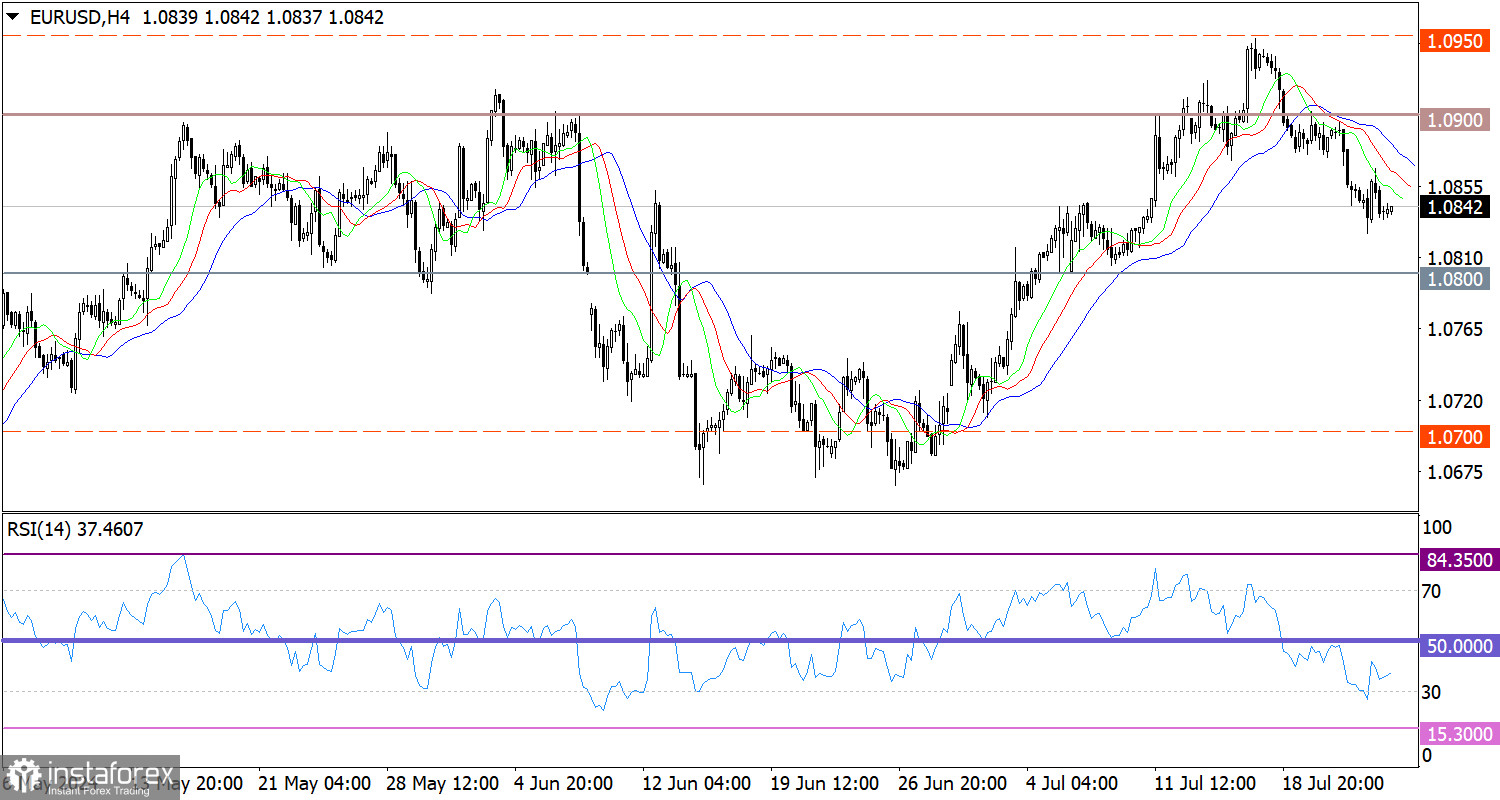
The corrective cycle slowed down around the 1.0825 level. This was followed by a pullback-stagnation phase, characterized by a typical realignment of trading forces. On the 4-hour chart, the RSI indicator is moving in the lower area of the 30/50 range, which suggests that the bearish bias remains intact. In the same time frame, the Alligator's MAs point downwards, aligning with the corrective cycle's direction. Outlook Assuming the bearish sentiment persists, the euro could fall to 1.0800. However, it is important to consider that the upward trend generally remains intact, and the current correction still fits within its cyclical phase. Therefore, it is crucial to carefully analyze potential support levels from which the price could initiate a rebound, possibly marking the beginning of a recovery process in the euro. In terms of the complex indicator analysis, we see that in the short term, technical indicators lack stable signals due to the stagnant phase. Meanwhile, in the intraday period, the indicators reflect a bearish cycle.

Analysis are provided by InstaForex.

Read more: https://ifxpr.com/3WEzf83
IFX Bella
 
Posts: 384
Joined: Sat Dec 08, 2012 12:39 am

PreviousNext

Return to Forex Brokers