Instaforex Analysis

Forex broker related topics and discussions

Re: Instaforex Analysis

Postby IFX Bella » Thu Jun 27, 2024 5:37 am

Forex Analysis & Reviews: USD/JPY: trading tips for beginners for the European session on June 27

Image

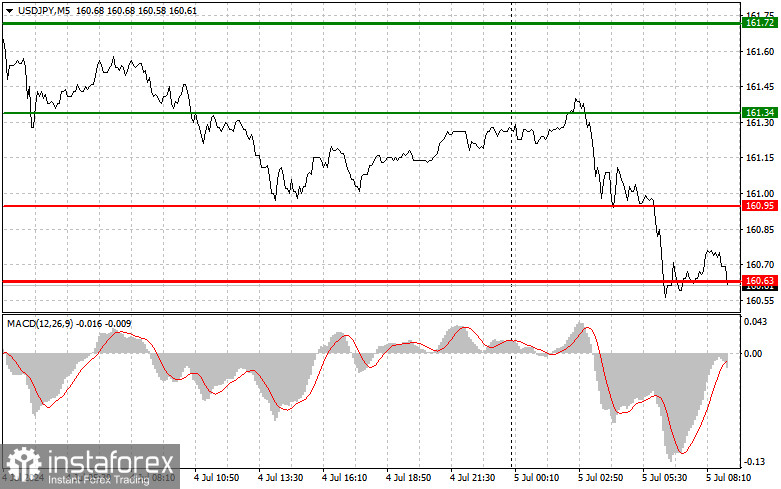
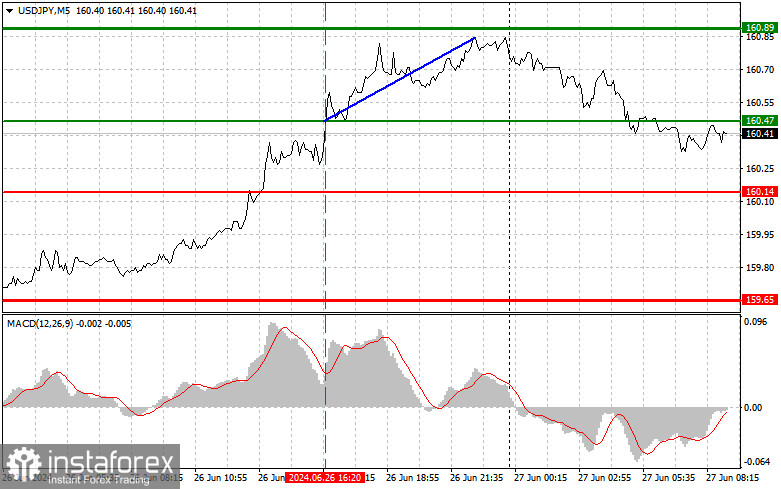
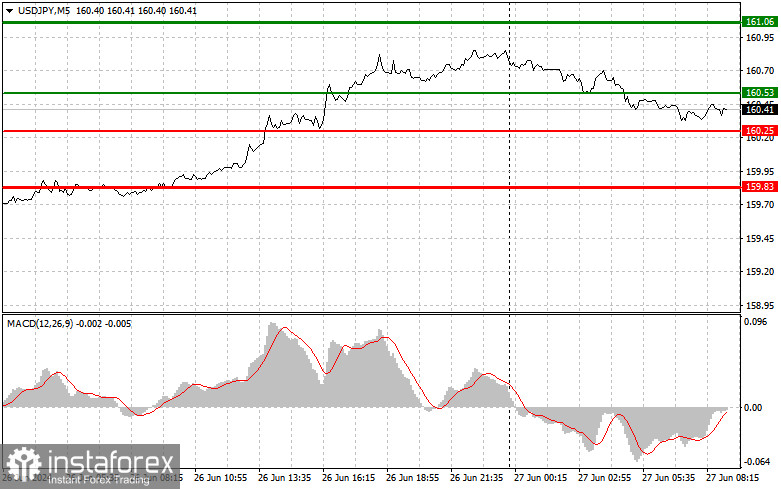
Overview of trading and tips on USD/JPY The price test of 160.47c occurred when the MACD indicator started to rise from the zero mark, which confirmed the correct entry point to buy the dollar during the ongoing bull market. As a result, the pair rose by more than 40 pips, in continuation of testing annual highs. As we can see, traders are completely ignoring weak data on the American economy and continue to actively put pressure on the Japanese yen, taking advantage of the significant difference in interest rates and the policies conducted by the central banks. It is unlikely that anything will change today, so it is better to rely on potential pullbacks and continue buying the dollar. As for the intraday strategy, I will rely more on the implementation of scenarios No. 1 and 2.

Image

What's on the chart: The thin green line is the entry price at which you can buy the trading instrument. The thick green line is the estimated price where you can set Take-Profit (TP) or manually close positions, as further growth above this level is unlikely. The thin red line is the entry price at which you can sell the trading instrument. The thick red line is the price where you can set Take-Profit (TP) or manually close positions, as further decline below this level is unlikely. MACD line: it is important to be guided by overbought and oversold areas when entering the market Important: Novice traders in the forex market need to be very careful when making decisions to enter the market. It is best to stay out of the market before important fundamental reports are released to avoid getting caught in sharp price fluctuations. If you decide to trade during news releases, always place stop orders to minimize losses. Without setting stop orders, you can quickly lose your entire deposit, especially if you don't use money management and trade in large volumes. And remember, for successful trading, it is necessary to have a clear trading plan, similar to the one I presented above. Spontaneously making trading decisions based on the current market situation is inherently a losing strategy for an intraday trader.


Analysis are provided by InstaForex.


Read more: https://ifxpr.com/4cgtHFT
IFX Bella
 
Posts: 392
Joined: Sat Dec 08, 2012 12:39 am

Re: Instaforex Analysis

Postby IFX Bella » Mon Jul 01, 2024 4:57 am

Forex Analysis & Reviews: EUR/USD and GBP/USD: Technical analysis on July 3

Image


EUR/USD


Higher timeframes Earlier, the market remained uncertain. With the start of a new week and month, a significant bullish gap has formed, followed by a sustained rise. Currently, the pair has reached the resistances of the daily (1.0762) and weekly (1.0767) Fibonacci Kijun levels. If the bullish bias remains intact and the pair breaks through these resistances, the next target will be the 1.0791 mark, which currently combines the daily mid-term trend and the weekly short-term trend. After this, the bulls will be drawn to the cluster of levels around 1.0817-29 (weekly mid-term trend + monthly short-term trend + daily cloud). For the bears, under the current conditions, breaking the support of the daily short-term trend (1.0718) and testing the low (1.0667) will be significant.


Image

GBP/USD


Higher timeframes GBP/USD ended the previous month in the area of uncertainty and consolidation. The weekly and daily time frames are forming and confirming the monthly sentiment. Currently, there is interaction with the weekly levels (1.2652-65) and the daily short-term trend (1.2675). The outcome will determine the further development of events. If the bulls prevail, the market will first focus on overcoming the resistances of the daily Ichimoku dead cross (1.2706 – 1.2736 – 1.2765). However, if the bearish bias proves stronger and the market returns below the weekly levels (1.2652-65), then the area of 1.2608 – 1.2596 (upper boundary of the daily cloud + weekly mid-term trend) will become significant.


Analysis are provided by InstaForex.

Read more: https://ifxpr.com/4cGvOTb
IFX Bella
 
Posts: 392
Joined: Sat Dec 08, 2012 12:39 am

Re: Instaforex Analysis

Postby IFX Bella » Tue Jul 02, 2024 2:45 am

Forex Analysis & Reviews: Forecast for EUR/USD on July 2, 2024

Image

EUR/USD Yesterday, the euro closed below the Kijun-sen line with a large upper shadow. The euro has failed to reach the target level of 1.0788, and it is likely on track to close the gap below the 1.0724 level. However, all these actions are taking place within the framework of waiting for the upcoming holiday on Thursday and the key US employment data on Friday, which is the main event of the week.

Image

The forecast for new non-farm payroll jobs in June is 189,000 compared to 272,000 in May. However, the negative trend in the overall number of unemployed last month (Continued Jobless Claims) suggests a worse non-farm payroll figure, around 150,000-160,000, similar to what we saw in November last year when the structure of Continued Jobless Claims was similar. In such a case, the euro might fall along with the stock market due to a risk-off effect.

On the 4-hour chart, the euro seems to be trying to retest the support at 1.0724. If the euro intends to close the gap, it can breach this support level. We can confirm the euro's intention to continue the downward movement when the price consolidates below the Kijun-sen line (1.0702). By that time, the Marlin oscillator will likely be in the downtrend territory (below the zero line).

Analysis are provided by InstaForex.

Read more: https://ifxpr.com/4clZfdN
IFX Bella
 
Posts: 392
Joined: Sat Dec 08, 2012 12:39 am

Re: Instaforex Analysis

Postby IFX Bella » Wed Jul 03, 2024 6:14 am

Forex Analysis & Reviews: Hot forecast for EUR/USD on July 3, 2024

Image

As expected, Eurozone inflation slowed to 2.5% in June from 2.6% a month earlier, but this did not affect the market since investors have long been anticipating further interest rate cuts by the European Central Bank. But the fact that the Eurozone unemployment rate remained unchanged, instead of increasing from 6.4% to 6.5%, left an impact on the market. As a result, the euro rose to the upper boundary of the narrow range, although it was quite a modest rise. The pair wouldn't be able to break out of this range today. Investors are eagerly awaiting the U.S. Department of Labor report, which is set for release on Friday. Until then, no one is willing to take risks. Furthermore, today is a short trading day in the United States due to the Independence Day celebrations tomorrow. Given that the single currency is near the upper boundary of the range, it is more likely for the pair to gradually move towards the lower boundary. However, we don't expect the price to reach this mark. Market activity on Wednesday is expected to be quite low.

The euro slightly strengthened against the US dollar, but no significant price changes were observed. The pair continues to move within the range of 1.0670/1.0750, with particular focus on the upper boundary. On the 4-hour chart, the RSI technical indicator is hovering in the upper area of 50/70, which indicates a bullish bias. Meanwhile, on the same chart, the Alligator's MAs are within the horizontal channel, but are heading upwards. Outlook Movement within the horizontal channel is temporary. The main strategy is to strengthen trading positions the moment the flat phase ends. We can confirm that the phase has ended once the price settles beyond either boundary of the range in the intraday period. In terms of complex indicator analysis, the short term period indicates a bearish bias, while the residual effect of the upward movement remains in the intraday period.


Analysis are provided by InstaForex.

Read more: https://ifxpr.com/3xIpuvF
IFX Bella
 
Posts: 392
Joined: Sat Dec 08, 2012 12:39 am

Re: Instaforex Analysis

Postby IFX Bella » Fri Jul 05, 2024 5:05 am

Forex Analysis & Reviews: USD/JPY: trading tips for beginners for the European session on July 5

Image

Overview of trading and tips on USD/JPY There were no price tests of the levels I mentioned in the U.S. session, so we did not get any good entry points. The U.S. holiday was the main reason why volatility was low. Despite the circumstances, sellers were determined to trade actively in today's Asian session, which led to the test of the weekly lows. Even weak data on household spending, which sharply decreased, did not hinder the pair's correction. The figures for the index of leading economic indicators matched economists' forecasts, but traders ignored this report. It is clear that the pair's further direction will entirely depend on the U.S. labor market data, and until then, we are unlikely to see a breakout and consolidation below the daily low. For this reason, I will try to look for reversal entry points, in anticipation of a small bullish correction. As for the intraday strategy, I will rely more on the implementation of scenarios No. 1 and 2.

Buy signals Scenario No. 1. Today, I plan to buy USD/JPY when the price reaches the entry point at 160.89 plotted by the green line on the chart, aiming for growth to 161.46 plotted by the thicker green line on the chart. Around 161.46, I'm going to exit long positions and open short ones in the opposite direction, expecting a movement of 30-35 pips in the opposite direction from that level. You can count on the pair to rise today after actively defending the intraday low. Before buying, make sure that the MACD indicator is above the zero mark and is just starting to rise from it. Scenario No. 2. I also plan to buy USD/JPY today in case of two consecutive tests of 160.52 when the MACD indicator is in the oversold area. This will limit the pair's downward potential and lead to a reverse market upturn. One can expect growth to the opposite levels of 160.89 and 161.46. Sell signals Scenario No. 1. I plan to sell USD/JPY today only after testing the level of 160.52 plotted by the red line on the chart, which will lead to a rapid decline in the price. The key target for sellers will be 159.95, where I am going to exit short positions and immediately open long ones in the opposite direction, expecting a movement of 20-25 pips in the opposite direction from that level. Pressure on USD/JPY may return at any moment within the bearish correction. Before selling, make sure that the MACD indicator is below the zero mark and is just starting to decline from it. Scenario No. 2. I also plan to sell USD/JPY today in case of two consecutive price tests at 160.89 when the MACD indicator is in the overbought area. This will limit the pair's upward potential and lead to a reverse market downturn. One can expect a decline to the opposite levels 160.52 and 159.95.

Analysis are provided by InstaForex.

Read more: https://ifxpr.com/3XQopMT
IFX Bella
 
Posts: 392
Joined: Sat Dec 08, 2012 12:39 am

Re: Instaforex Analysis

Postby IFX Bella » Mon Jul 08, 2024 5:30 am

Forex Analysis & Reviews: Hot forecast for EUR/USD on July 8, 2024

Image

Although 206,000 new jobs were created outside the agricultural sector, significantly exceeding the forecast of 160,000, the overall content of the US Department of Labor report turned out to be simply appalling. This was mostly due to the downward revision of previous data from 272,000 to 218,000. This means that for three consecutive months, fewer than 250,000 new jobs have been created, which is not even enough to maintain labor market stability. Consequently, the unemployment rate rose from 4.0% to 4.1%. In other words, unemployment has been rising for three consecutive months. This sharply increases the likelihood of interest rate cuts during the upcoming Federal Open Market Committee meeting, which led to the dollar's weakness. The issue lies in the extremely weak data, which were significantly worse than expected. Considering that today's economic calendar is practically empty, the market will be guided by other factors, particularly the dollar's oversold condition. In addition, the results of the early parliamentary elections in France are likely to disappoint the markets. This is not so much due to the defeat of President Macron's party but rather because of the clear victory of parties that the media describe as far-right. From the perspective of leading business publications, which significantly influence the markets, this is a highly negative factor. Thus, the dollar has every chance to recover some of its recent losses.

EUR/USD closed the week above the level of 1.0800, which in terms of technical analysis is a sign that the market sentiment is bullish. On the 4-hour chart, the RSI reached the overbought zone and left. Based on the absence of a complete corrective movement, we can conclude that at this time the market is reassessing long positions on the euro. On the same chart, the Alligator moving averages are headed upwards, which corresponds to the upward cycle. Outlook If we focus solely on the technical analysis, keeping the price above the level of 1.0800 may eventually lead to further growth for the euro, on the basis of which it is possible to test the local high of the medium-term trend. The bearish scenario will come into play in case of a pullback, if the price settles below the level of 1.0800 for at least a 4-hour period. In terms of complex indicator analysis, the short-term period does not have stable indicators since the price is stagnant. In the daily period, the bullish sentiment is still in force.


Analysis are provided by InstaForex.

Read more: https://ifxpr.com/4637Dwf
IFX Bella
 
Posts: 392
Joined: Sat Dec 08, 2012 12:39 am

Re: Instaforex Analysis

Postby IFX Bella » Tue Jul 09, 2024 3:30 am

Forex Analysis & Reviews: Hot forecast for EUR/USD on July 9, 2024

Image

In the absence of any economic reports or news, the market remained in its previous positions. But today it must move. And it's not about the imminent release of US inflation data. After all, this data will be released on Thursday. Today, Federal Reserve Chief Jerome Powell will testify before the US Senate Banking Committee. And tomorrow, he is due to report to the House of Representatives. Politicians will certainly raise the issue of interest rates, especially since the unemployment rate in the United States has been rising for three consecutive months. As a result, the market has revised its expectations regarding the timing and pace of the Federal Reserve's monetary policy easing. Investors are hoping to receive confirmation of the updated forecasts. If these expectations are met, the dollar will resume its decline.

EUR/USD maintains a bullish bias after settling above the 1.0800 level. As a result, there is an increase in the volume of long positions. This may point to the recovery process in the euro. On the 4-hour chart, the RSI technical indicator is hovering in the upper area of 50/70, which points to the bullish sentiment. On the same chart, the Alligator moving averages are headed upwards, which corresponds to the upward cycle. Outlook If the price settles above the 1.0800 mark, it could climb to the 1.0900 level. The bearish will come into play if the price returns below the 1.0800 level.

Analysis are provided by InstaForex.

Read more: https://ifxpr.com/4eYrKj9
IFX Bella
 
Posts: 392
Joined: Sat Dec 08, 2012 12:39 am

Re: Instaforex Analysis

Postby IFX Bella » Wed Jul 10, 2024 4:46 am

Forex Analysis & Reviews: Hot forecast for EUR/USD on July 10, 2024

Image

Although senators asked Jerome Powell questions about lowering interest rates, the head of the Federal Reserve System gave little away and he gave evasive answers. So, the situation remains unchanged. Today's speech in the House of Representatives is unlikely to bring anything new either. Moreover, the U.S. central bank is waiting for inflation data, which will be released tomorrow. Thus, the most likely scenario is a period of market stagnation.

Despite the fact that the EUR/USD pair has slowed down its upward cycle, the quote has been holding above the 1.0800 level for five trading days. This points to bullish sentiment. On the 4-hour chart, the RSI technical indicator is hovering in the upper area of 50/70, which corresponds to an upward trend. On the same chart, according to the Alligator indicator, two out of the three moving average lines are intertwined. This indicates that the upward cycle is stagnant. Outlook The euro could rise further if the price settles above the 1.0800 level. We expect an increase in the volume of long positions above the 1.0850 mark. The bearish scenario will come into play if the price returns below the 1.0800 level. Comprehensive indicator analysis in the short term does not have stable indicators due to stagnation. In the intraday period, the indicators are reflecting an upward cycle.

Analysis are provided by InstaForex.

Read more: https://ifxpr.com/4cXsKm3
IFX Bella
 
Posts: 392
Joined: Sat Dec 08, 2012 12:39 am

Re: Instaforex Analysis

Postby IFX Bella » Thu Jul 11, 2024 2:57 am

Forex Analysis & Reviews: Technical Analysis of Weekly Price Movement of S&P 500 Index, Thursday July 11 2024.

Image

Even though on the weekly chart the S&P 500 index still appears to be dominated by Buyers, this is indicated and confirmed by the price movement of #SPX which moves harmoniously in an upward channel and the price movement is above the EMA 20 & EMA 50, but with the appearance of deviations between price movements #SPX which makes higher-highs in its price movements while the MACD indicator makes higher-lows on the contrary, so in the next 1 to 2 weeks it has the potential to be corrected and weakened down to level 5322.39, but as long as the weakening correction does not penetrate below level 4946.59, this index will still has the opportunity to strengthen again to level 5919.63.

Analysis are provided by InstaForex.

Read more: https://ifxpr.com/3WhML0X
IFX Bella
 
Posts: 392
Joined: Sat Dec 08, 2012 12:39 am

Re: Instaforex Analysis

Postby IFX Bella » Fri Jul 12, 2024 5:12 am

Forex Analysis & Reviews: Hot forecast for EUR/USD on July 12, 2024

Image

Inflation in the United States was expected to decrease from 3.3% to 3.1%, which in itself convinced the market of the imminent start of monetary policy easing by the Federal Reserve. However, US consumer inflation eased to 3.0% in June. As a result, the dollar immediately started to lose its positions quite significantly. The market is now convinced of two Fed rate cuts by the end of the year. The first rate cut is expected in September, and the second in December. These forecasts and expectations are quite justified. So, locally, the market is entering a phase where the USD stays lower. Of course, there will be pauses and minor pullbacks along this path. Something similar was observed yesterday, closer to the end of the U.S. trading session. Most likely, the pullback will continue today, and the market will try to settle slightly below current values. After that, the pair could move towards the dollar's decline.

During speculative growth, EUR/USD almost reached the level of 1.0900, and the volume of long positions decreased. As a result, the market experienced a minor pullback, which can be considered a process of regrouping trading forces. On the 4-hour chart, the RSI locally ended up in the overbought zone when it reached the resistance level of 1.0900. On the same chart, the Alligator's MAs are headed upwards, which reflects the quote's movement. Outlook To start a new wave of growth, the price must settle above the 1.0900 level. Otherwise, the current pullback may linger in the market. In terms of complex indicator analysis, a pullback is likely in the short term. Indicators signal an upward cycle in the intraday period.

Analysis are provided by InstaForex.

Read more: https://ifxpr.com/3zDZu5n
IFX Bella
 
Posts: 392
Joined: Sat Dec 08, 2012 12:39 am

PreviousNext

Return to Forex Brokers


cron