Instaforex Analysis

Forex broker related topics and discussions

Re: Instaforex Analysis

Postby IFX Bella » Wed May 15, 2024 3:24 am

Forex Analysis & Reviews: Technical Analysis of Intraday Price Movement of AUD/JPY Cross Currency Pairs, Wednesday May 15, 2024.

Image

With the Golden Cross crossing of the EMA 50 which is above the EMA 200 on the 4 hour chart, the AUD/JPY cross currency pair clearly gives an idea that Buyers still dominate the cross currency pair on the 4 hour chart, but with the appearance of deviations between AUD/JPY price movements and The Stochastic Oscillator indicator gives a hint that in the near future there will be a weakening correction in AUD/JPY which has the potential to fall lower to the level of 103.05, but as long as the weakening correction does not fall further below the level of 102.69 then AUD/JPY still has the opportunity to continue strengthening again today up to level 103.64 as the main target and if the momentum and volatility are supportive enough then it is not impossible that level 104.85 will be the next target to be aimed at.

Analysis are provided by InstaForex.


Read more: https://www.instaforex.eu/forex_analysis/149012
IFX Bella
 
Posts: 128
Joined: Sat Dec 08, 2012 12:39 am

Re: Instaforex Analysis

Postby IFX Bella » Thu May 16, 2024 4:52 am

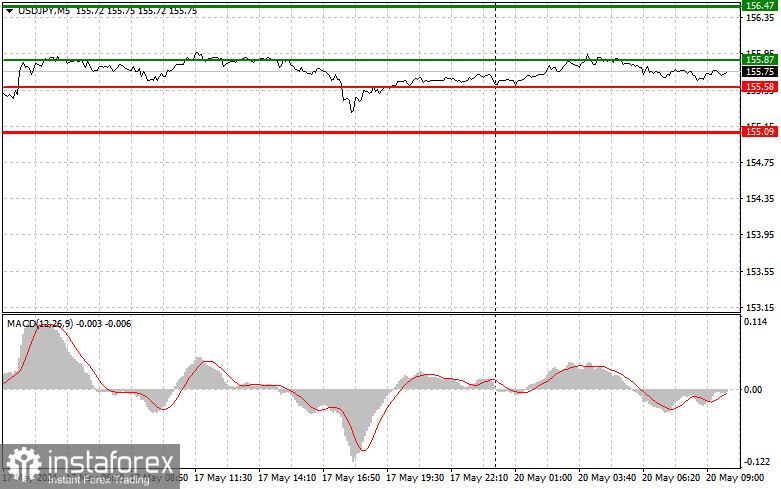
Forex Analysis & Reviews: EUR/USD: trading tips for beginners for European session on May 16

Image

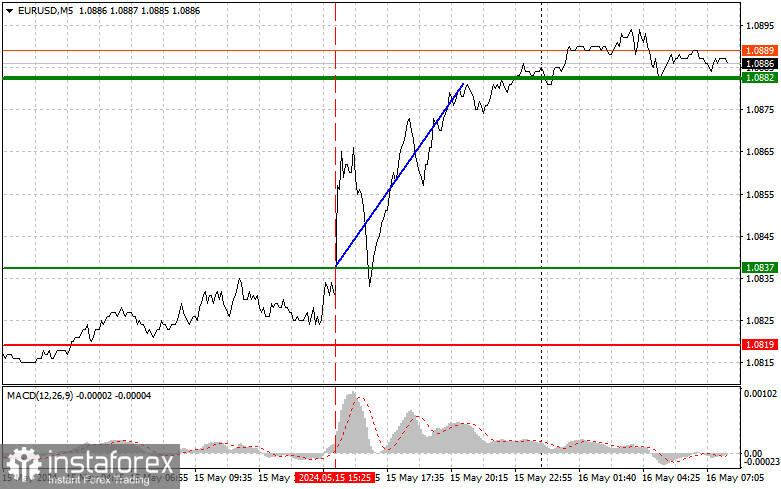
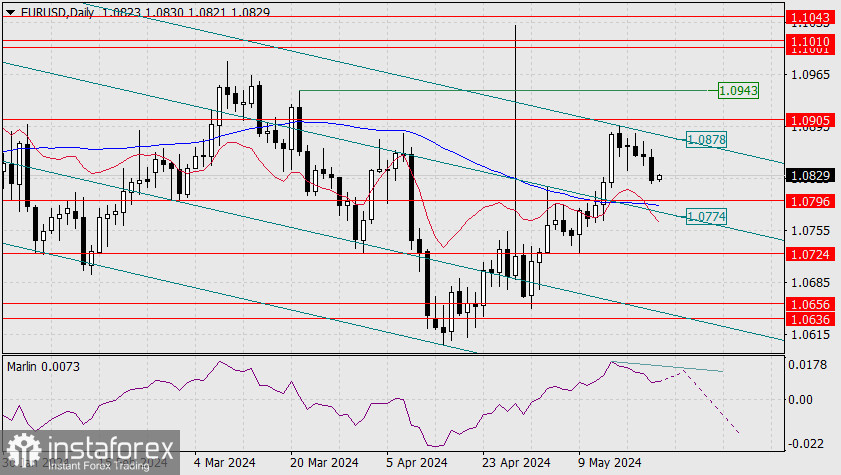
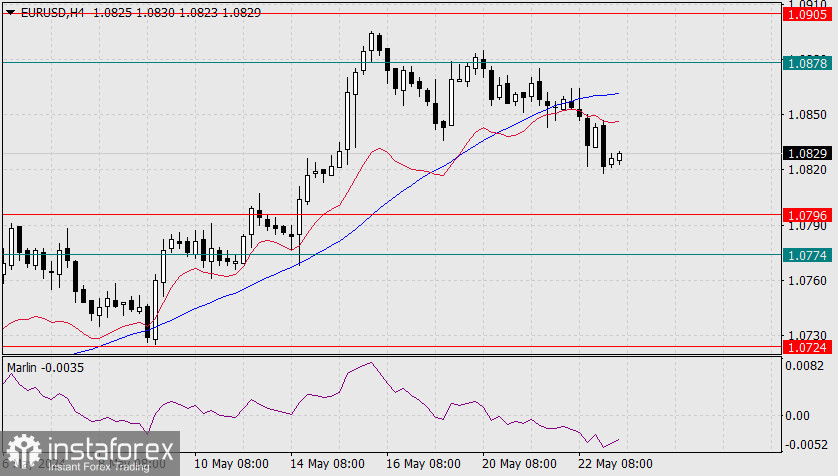
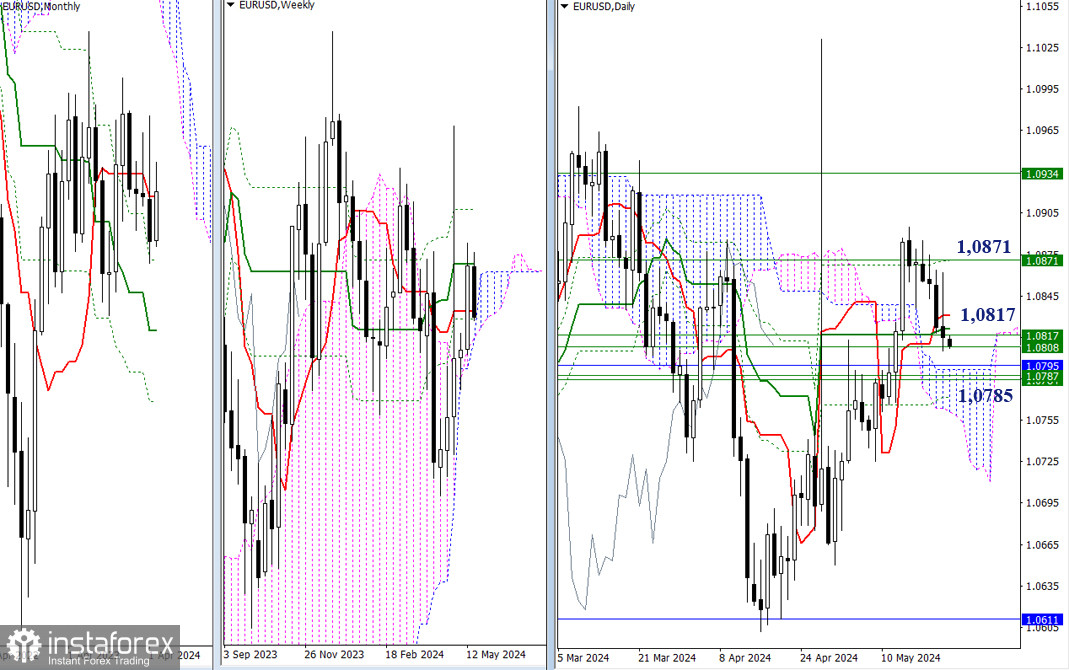
The price test of 1.0837 occurred at a time when the MACD indicator was just starting to move up from the zero mark, which confirmed the entry point to buy the euro. As a result, the EUR/USD pair rose to the area of the target level at 1.0882, so traders could earn approximately 50 pips of profit. There was no market reaction to reports on the Consumer Price Index in France, Eurozone GDP, employment, and industrial production. However, the US inflation data turned the market around, giving euro buyers a very strong impetus. Today, the uptrend may persist, but this requires good forecasts from the European Commission and a decent report on the financial stability of the Eurozone. There are no other reports, so if the market withstands weak data and pressure from sellers, then obviously, the euro may continue to rise in the afternoon. It is better to act according to the trend and look for buy signals. As for the intraday strategy, I will rely more on the implementation of scenarios No. 1 and 2.

Image

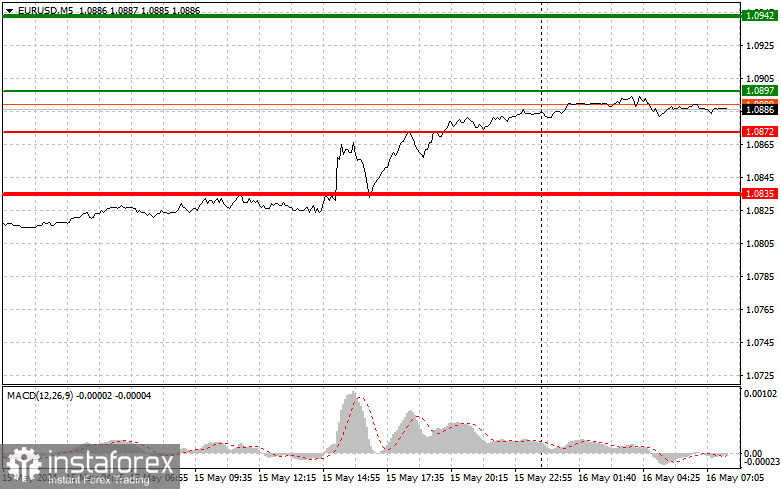
Buy signals Scenario No 1. Today, you can buy the euro when the price reaches 1.0897 plotted by the green line on the chart, aiming for growth to the level of 1.0942. At the level of 1.0942, I plan to exit the market and also sell the euro in the opposite direction, counting on a movement of 30-35 pips from the entry point. You can count on the euro to rise today within the framework of an emerging uptrend, as well as after good news on the Eurozone. Before buying, make sure that the MACD indicator is above the zero mark and is just starting to rise from it. Scenario No 2. I am also going to buy the euro today in case of two consecutive tests of the price of 1.0872 at the time when the MACD indicator is in the oversold area. This will limit the downward potential of the instrument and lead to an upward reversal of the market. We can expect growth to the opposite levels of 1.0897 and 1.0942. Sell signals Scenario No 1. I plan to sell the euro after EUR/USD reaches the level of 1.0872 plotted by the red line on the chart. The target will be the level of 1.0835, where I am going to exit the market and buy immediately in the opposite direction (expecting a movement of 20-25 pips in the upward direction from the level). Pressure on EUR/USD will increase if it fails to consolidate near the daily high and weak Eurozone data. Before selling, make sure that the MACD indicator is below the zero mark and is just starting to decline from it. Scenario No 2. I am also going to sell the euro today in case of two consecutive price tests of 1.0897 at the time when the MACD indicator is in the overbought area. This will limit the pair's upward potential and lead to a downward reversal of the market. We can expect a decline to the opposite level of 1.0872 and 1.0835.

Analysis are provided by InstaForex.


Read more: https://ifxpr.com/3UFuLM9
IFX Bella
 
Posts: 128
Joined: Sat Dec 08, 2012 12:39 am

Re: Instaforex Analysis

Postby IFX Bella » Fri May 17, 2024 4:33 am

Forex Analysis & Reviews: USD/JPY: trading tips for beginners for European session on May 17

Image

Overview of trading and tips on USD/JPY The price test of 155.15 occurred at a time when the MACD indicator had significantly risen from the zero mark, which affected the dollar's potential to rise. For this reason, I did not buy, even though the upward movement remained intact. Yesterday, Japan's GDP report exerted pressure on the yen, and despite weak US labor market data, which suggests that it's time for the Federal Reserve to stop, the dollar recovered most of the losses incurred against the backdrop of US inflation data. The USD/JPY may continue to strengthen today, but it's better to buy on corrections. This way, you can have a greater margin of movement, without relying on the assumption that major players will want to storm weekly highs at the end of the week. As for the intraday strategy, I will rely more on the implementation of scenarios No. 1 and 2.


Image


Buy signals Scenario No. 1. I plan to buy USD/JPY today when the price reaches the entry point at 155.94 plotted by the green line on the chart, aiming for growth to 156.60 plotted by the thicker green line on the chart. In the area of 156.60, I'm going to exit long positions and open short ones in the opposite direction, expecting a movement of 30-35 pips in the opposite direction from that level. You can count on USD/JPY's growth today in continuation of the trend. Before buying, make sure that the MACD indicator is above the zero mark and is just starting to rise from it. Scenario No. 2. I also plan to buy USD/JPY today in case of two consecutive tests of 155.41 at the time when the MACD indicator is in the oversold area. This will limit the downward potential of the pair and lead to an upward reversal of the market. We can expect growth to the opposite levels of 155.94 and 156.60. Sell signals Scenario No. 1. I plan to sell USD/JPY today only after testing the level of 155.41 plotted by the red line on the chart, which will lead to a rapid decline in the price. The key target for sellers will be 154.84, where I am going to exit short positions and also immediately open long ones in the opposite direction, expecting a movement of 20-25 pips in the opposite direction from that level. Pressure on USD/JPY may return in case the price fails to settle near today's high. Before selling, make sure that the MACD indicator is below the zero mark and is just starting to decline from it. Scenario No. 2. I also plan to sell USD/JPY today in case of two consecutive tests of the price of 155.94 at the time when the MACD indicator is in the overbought area. This will limit the pair's upward potential and lead to a downwards market reversal. We can expect a decline to the opposite levels of 155.41 and 154.84.

Analysis are provided by InstaForex.

Read more: https://ifxpr.com/44OmOcg
IFX Bella
 
Posts: 128
Joined: Sat Dec 08, 2012 12:39 am

Re: Instaforex Analysis

Postby IFX Bella » Mon May 20, 2024 5:16 am

Forex Analysis & Reviews: USD/JPY: trading tips for beginners for European session on May 20


Image

The price test of 155.63 occurred at a time when the MACD indicator had significantly dropped from the zero mark, which affected the dollar's potential to fall. For this reason, I did not sell, even though the signal looked quite promising. As a result, the pair was down 30 pips, but the downward movement was quickly bought back before the end of the US session. Today, there are no significant economic reports from Japan or the US, and perhaps only speeches by Federal Reserve representatives might influence the market. I intend to focus on the development of the upward trend, taking advantage of good dips in USD/JPY, which may occur throughout the day. As for the intraday strategy, I will rely more on the implementation of scenarios No. 1 and 2.

Image

Buy signals Scenario No. 1. I plan to buy USD/JPY today when the price reaches the entry point at 155.87 plotted by the green line on the chart, aiming for growth to 156.47 plotted by the thicker green line on the chart. In the area of 156.47, I'm going to exit long positions and open short ones in the opposite direction, expecting a movement of 30-35 pips in the opposite direction from that level. You can count on USD/JPY's growth today in continuation of a developing trend. Before buying, make sure that the MACD indicator is above the zero mark and is just starting to rise from it. Scenario No. 2. I also plan to buy USD/JPY today in case of two consecutive tests of 155.58 at the time when the MACD indicator is in the oversold area. This will limit the downward potential of the pair and lead to an upward reversal of the market. We can expect growth to the opposite levels of 155.87 and 156.47. Sell signals Scenario No. 1. I plan to sell USD/JPY today only after testing the level of 155.58 plotted by the red line on the chart, which will lead to a rapid decline in the price. The key target for sellers will be 155.09, where I am going to exit short positions and also immediately open long ones in the opposite direction, expecting a movement of 20-25 pips in the opposite direction from that level. Pressure on USD/JPY may return in case the price fails to settle near the day's high. Before selling, make sure that the MACD indicator is below the zero mark and is just starting to decline from it. Scenario No. 2. I also plan to sell USD/JPY today in case of two consecutive tests of the price of 155.87 at the time when the MACD indicator is in the overbought area. This will limit the pair's upward potential and lead to a downwards market reversal. We can expect a decline to the opposite levels of 155.58 and 155.09.

Analysis are provided by InstaForex.


Read more: https://ifxpr.com/4e0AMfl
IFX Bella
 
Posts: 128
Joined: Sat Dec 08, 2012 12:39 am

Re: Instaforex Analysis

Postby IFX Bella » Wed May 22, 2024 4:45 am

Forex Analysis & Reviews: Technical Analysis of Intraday Price Movement of AUD/JPY Cross Currency Pairs, Wednesday May 22, 2024.

Image


On the 4 hour chart, Silver commodity asset is appear, although the price is moving above WMA 20 which indicates that there are still a lot of buyers of this commodity asset. But if we pay attention, the level of 32,444 failed to be broken a few times which shows that in the near future Silver has the potential to corrected downwards where level 31,033 has the potential to be tests. If it managed to break, then Silver willgo to level 30,320 as the main target and if the momentum and volatility are supportive then level 29,615 will be the next target, but if on its way to these target levels it suddenly strengthens again and breaks above level 32,444 then all the weakening correction scenarios that have been described will become invalid and cancel itself.


News are provided by InstaForex.


Read more: https://ifxpr.com/4bupBcS
IFX Bella
 
Posts: 128
Joined: Sat Dec 08, 2012 12:39 am

Re: Instaforex Analysis

Postby IFX Bella » Thu May 23, 2024 3:49 am

Forex Analysis & Reviews: Forecast for EUR/USD pair on May 23, 2024

Image


EUR/USD Yesterday, the markets showed reduced risk appetite – the S&P 500 stock index fell by 0.27%, and the dollar index rose by 0.29%. Now, the euro has three short-term development options:

The growth continues to the target level of 1.0905, forming a divergence marked by a dashed line on the oscillator chart. Growth will be limited to the upper boundary of the new descending price channel at the 1.0878 mark solely to confirm its validity and then reverse downward from there. Decline to the nearest inner line of the new channel at the 1.0774 mark to confirm the validity and accuracy of this line and the entire channel. Additionally, it should be noted that the MACD line is approaching the 1.0774 mark. Therefore, the price must consolidate below this level for the euro to reverse into a downtrend. Until then, the price can behave in various ways – forming a flag, pennant, double top, etc. Nevertheless, there is a 55% probability that the correction peaked on May 16.

Image

On the four-hour scale, the price has settled below the balance and MACD indicator lines, and the Marlin oscillator is deepening into the territory of a downtrend. The MACD line itself is starting to turn downward. The trend is descending, confirming the likelihood of an already occurred reversal. However, this situation does not prevent the price from complicating the sideways movement


News are provided by InstaForex.


Read more: https://ifxpr.com/4bqF4uw
IFX Bella
 
Posts: 128
Joined: Sat Dec 08, 2012 12:39 am

Re: Instaforex Analysis

Postby IFX Bella » Fri May 24, 2024 8:15 am

Forex Analysis & Reviews: EUR/USD and GBP/USD: Technical analysis on May 24

Image


Higher Timeframes The bears are trying to extend the downward movement. Since they encountered a wide support area, they started testing it. In order to strengthen the bearish bias under current conditions, sellers need to overcome 1.0817 - 1.0808 - 1.0795 - 1.0785 and go beyond the daily and weekly Ichimoku clouds, consolidating in the bearish zone relative to the clouds. The weekly medium-term trend that was left behind (1.0871) currently serves as resistance and the nearest target in case the bulls recover their positions.


Image

H4 – H1 On the lower timeframes, the weekly long-term trend managed to accomplish its task yesterday, so the bears still have the advantage. The bearish bias can be improved further through testing and overcoming supports of classic Pivot levels (1.0793 - 1.0770 - 1.0736). Today's key levels can be found at 1.0827 - 1.0850 (central Pivot level + weekly long-term trend). A breakout and consolidation above these marks will affect the current balance of power, so the bulls can still gain the upperhand. In this case, the next bullish targets will be 1.0884 - 1.0907 (resistance of classic Pivot levels).

Image


H4 – H1 On the lower timeframes, the bears have now moved below and consolidated under key levels. As a result, the bears have the advantage. To build on the bearish sentiment, a decline must be realized by testing and breaking through the supports of the classical Pivot levels, which are located at 1.2670 – 1.2647 – 1.2609. It is very easy to lose the current advantage since the market hasn't moved far from the key levels. Rising and consolidating above the key levels of 1.2708-06 (central Pivot level + weekly long-term trend) will push the balance of power back to the bulls' side, and it is possible to strengthen positions by breaching the resistances of the classical Pivot levels (1.2731 – 1.2769 – 1.2792). ***


News are provided by InstaForex.


Read more: https://ifxpr.com/3UXOoPw
IFX Bella
 
Posts: 128
Joined: Sat Dec 08, 2012 12:39 am

Re: Instaforex Analysis

Postby IFX Bella » Mon May 27, 2024 3:51 am

Forex Analysis & Reviews: Forecast for GBP/USD on May 27, 2024

Image


GBP/USD On Friday, the British pound managed to hit the target resistance level of 1.2745 for the third time in three sessions. The signal line of the Marlin oscillator continues its steady decline, so considering today's holiday in the UK, an upward breakout is unlikely.

Image

But if there is a noticeable pullback, it will be easier for speculators to continue it on Tuesday. The nearest target for the move is the MACD indicator line around the 1.2635 mark. On the 4-hour chart, the price is making the first steps towards consolidating below the 1.2745 level.

The Marlin oscillator has reached the boundary of the uptrend territory, and now we are waiting for an external signal for a breakout or reversal. The probability of a reversal is higher. If the price consolidates below the MACD line on H4 (1.2713), it will allow the pair to confidently form a sideways movement for 1-2 days, after which the price could fall to 1.2635 and below to the range of 1.2574/96.

News are provided by InstaForex.

Read more: https://ifxpr.com/3yyY1wx
IFX Bella
 
Posts: 128
Joined: Sat Dec 08, 2012 12:39 am

Re: Instaforex Analysis

Postby IFX Bella » Tue May 28, 2024 3:22 am

Forex Analysis & Reviews: Forecast for EUR/USD on May 28, 2024

Image

EUR/USD The euro closed Monday up by 12 pips. This morning, the single currency continued to rise, which shows that it intends to reach the upper boundary of the price channel (1.0873). Until the price consolidates above this level, the price will continue to fluctuate within the sideways range before (as we expect) it falls towards a strong support level at 1.0796. The Marlin oscillator barely reacted to yesterday's rise.

Image

Today, the U.S. Treasury is auctioning bills and bonds totaling $344 billion, with an auction for 2-year and 7-year notes totaling $72 billion scheduled for tomorrow. Typically, such significant volumes are sold with a strong (stable) dollar to maintain investor interest. In turn, investors buy dollars to purchase bonds. The second estimate of GDP numbers for Q1 will be released on Thursday. Against this backdrop, the euro has little room for gro

On the 4-hour chart, the euro is testing the MACD indicator line, which has closely approached the target level of 1.0873. The Marlin oscillator is optimistic, but we can only see signs of growth when the price consolidates above 1.0873. A break below yesterday's low at 1.0841 will serve as a signal that the price will fall. However, we also consider the possibility that the price could move sideways until the end of the week.

News are provided by InstaForex.

Read more: https://ifxpr.com/4aLaJpC
IFX Bella
 
Posts: 128
Joined: Sat Dec 08, 2012 12:39 am

Re: Instaforex Analysis

Postby IFX Bella » Wed May 29, 2024 3:23 am

Forex Analysis & Reviews: EUR/USD and GBP/USD: Technical analysis on May 29

Image

Higher timeframes The bulls faced yet another setback. Yesterday, they failed to update the pair's high (1.0895) and move beyond the weekly resistances (1.0859 - 1.0871). As a result, EUR/USD bounced downwards. To confirm and work on this today, it is necessary to overcome the influence of the main levels of the daily cross at 1.0848 - 1.0840 (Tenkan + Kijun). After this, the next challenge will be interacting with a solid support area, which includes several strong levels from higher timeframes within a narrow range (1.0817 - 1.0792).

Image

H4 – H1 On the lower timeframes, the bearish correction has led to a test of the weekly long-term trend (1.0845). Breaking through this level could change the current balance of power. The next bearish targets after the intraday break will be the classic Pivot levels (1.0844 - 1.0832 - 1.0809). In case of a rebound from the weekly long-term trend, the focus will shift to recovering lost positions, bringing the market's focus to the resistance levels of the classic Pivot points. Currently, these resistances are located at 1.0867 - 1.0879 - 1.0902 - 1.0914.

Image

H4 – H1 A correction is currently developing on the lower timeframes. The market is approaching a key level – the weekly long-term trend at 1.2738, which determines the current balance of power. Its outcome could set the course for further development. A rebound would shift the focus to the resistance levels of the classic Pivot points, which are located at 1.2770, 1.2786, 1.2816, and 1.2832. Conversely, a breakthrough would place the focus on the support levels of the classic Pivot points at 1.2724 and 1.2694.

Image

News are provided by InstaForex.

Read more: https://ifxpr.com/4e0SqiY
IFX Bella
 
Posts: 128
Joined: Sat Dec 08, 2012 12:39 am

PreviousNext

Return to Forex Brokers