Point and Figure for Forex. Any pair.Charts.

Start your personal journal and share your trading results and experience

Re: Point and Figure for Forex. Any pair.Charts.

Postby MDunleavy » Mon Oct 22, 2012 1:54 am

–Gold Prices Range bound till New Effective Triggers are seen:
–Gold traders now look ahead to next week and movements in gold prices will be taking cues from the FOMC interest rate decision on Wednesday and Q3 GDP data on Friday.
–It is highly unlikely for the Fed to change its QE3 decision in the October 2 day FOMC meeting, which concludes Wednesday.
–Although the central bank is not expected to alter its policy stance, investors will be closely eyeing the accompanying statement for an updated assessment of the domestic economy.
–If the Fed adds concerns about inflation and rising prices, gold prices will remain well supported as investors flock into gold bullion as a traditional hedge against inflationary pressures.
–The Fed may also keep focus on what to do when Operation Twist ends in December.
[Written forexpros]
~~~~~~~~~~~~~~~~~
↓↓↓ Click to learn more! ↓↓↓
Code: Select all
https://docs.google.com/spreadsheet/pub?key=0AhxKzvQ2GlM8dDBqYWl6XzlEbFZDWFVob0FMbG9nbGc&output=html

Image
See also
~~~> h*ttps://docs.google.com/file/d/0BxxKzvQ2GlM8MUVRNkxibXlpSms/preview
↑↑↑ OR ↓↓↓
~~~> h*ttp://img443.imageshack.us/img443/8240/12oct21.pdf
A d d i t i o n a l l y
FOREX MetaTrader Expert Advisors
Point & Figure :) :( Chart in Forex
User avatar
MDunleavy
 
Posts: 284
Joined: Fri Oct 30, 2009 1:43 am

Re: Point and Figure for Forex. Any pair.Charts.

Postby MDunleavy » Sat Oct 27, 2012 2:18 pm

–The AUD/USD pair initially fell during the week, but found a bit of a bid later on and formed a hammer.
–This is right after to shooting stars, and is in the middle of a massive consolidation area.
–We figure that this pair will be very difficult to trade, although it does look bullish at the moment.
–As for a longer-term point of view, the Reserve Bank of Australia is slated to cut rates at least once if not twice.
–This should weigh upon the Australian dollar going forward, as well as all the global risks out there.
–However, it appears that as far as longer-term trader concerned, we need to break above the 1.06 level to have complete clarity higher.
–If we managed to break down below the 1.0150 level however, we figure that this pair will absolutely crumble.
[Written by fxempire]
↓↓↓ Click to learn more!↓↓↓
Code: Select all
https://docs.google.com/spreadsheet/pub?key=0AhxKzvQ2GlM8dDBqYWl6XzlEbFZDWFVob0FMbG9nbGc&output=html

Image
See also
~~~> _https://docs.google.com/file/d/0B9cvIxidsTjvZFVnNDZGTjJ3ZXM/preview
↑↑↑ OR ↓↓↓
~~~> _http://img827.imageshack.us/img827/7477/12oct27.pdf
A d d i t i o n a l l y
FOREX MetaTrader Expert Advisors
Point & Figure :) :( Chart in Forex
User avatar
MDunleavy
 
Posts: 284
Joined: Fri Oct 30, 2009 1:43 am

Re: Point and Figure for Forex. Any pair.Charts.

Postby MDunleavy » Sun Nov 11, 2012 4:03 am

EURUSD Analysis 10th November 2012 – P&F Update...

Image
↓↓↓ Click to learn more!↓↓↓
Code: Select all
https://docs.google.com/spreadsheet/pub?key=0AhxKzvQ2GlM8dDBqYWl6XzlEbFZDWFVob0FMbG9nbGc&output=html
https://docs.google.com/file/d/0BxxKzvQ2GlM8ZmRlMjViOTMtNjAyMS00NzUxLWFjMjEtODk0ZjFlNzg5YzQ5/preview

See also vvv
~~~> _http://img7.imageshack.us/img7/3057/12nov10.pdf
A d d i t i o n a l l y^^^

||BJF Trading Group||Expert Advisor||MT Indicator||Forex Software||MQL4 Coding||
FOREX MetaTrader Expert Advisors
Point & Figure :) :( Chart in Forex
User avatar
MDunleavy
 
Posts: 284
Joined: Fri Oct 30, 2009 1:43 am

Re: Point and Figure for Forex. Any pair.Charts.

Postby MDunleavy » Mon Nov 19, 2012 2:54 am

•The dollar index continues to remain firmly bullish on the daily chart, moving higher and breaking above the 81 region, as the currency of first reserve continues to strengthen following the U.S. election.
•This firm move higher for the U.S. dollar has been accompanied by sustained buying volume on both the daily and the three day chart, which have both provided additional momentum to the move higher, following the key breakout from the sideways congestion created during September and October, which saw the index trade in a narrow range.
•This platform of support is now providing the necessary springboard, and with the Hawkeye Heatmap now firmly green, the U.S. dollar looks set to continue higher in the short to medium term.
•Should the three day trend also transition through to bullish in due course, then we can expect to see the index climb to test the 83.00 region and beyond with consequent weakness across the major currency pairs, along with commodities. [Written by forexpros]
Image
↓↓↓Click to learn more!↓↓↓
Code: Select all
https://docs.google.com/spreadsheet/pub?key=0AhxKzvQ2GlM8dDBqYWl6XzlEbFZDWFVob0FMbG9nbGc&output=html

See also
~~~> _https://docs.google.com/file/d/0B9cvIxidsTjvYnFHMWVmM25oVlk/preview
↑↑↑ OR ↓↓↓
~~~> _http://img822.imageshack.us/img822/5085/12nov18.pdf
A d d i t i o n a l l y

||BJF Trading Group||Expert Advisor||MT Indicator||Forex Software||MQL4 Coding||
FOREX MetaTrader Expert Advisors
Point & Figure :) :( Chart in Forex
User avatar
MDunleavy
 
Posts: 284
Joined: Fri Oct 30, 2009 1:43 am

Re: Point and Figure for Forex. Any pair.Charts.

Postby MDunleavy » Mon Nov 26, 2012 7:01 am

Crude Oil Weekly Technical Outlook
•Sat Nov 24 12 09:51 ET Crude Oil Weekly Technical Outlook Nymex Crude Oil (CL)Crude oil edged higher to 89.98 last week but failed to take out 90 psychological level and retreated again.
•Nonetheless, note that firstly, it's has taken out near term falling channel.
•Secondly, it seems to be well supported by 4 hours 55 EMA.
•Thirdly, daily MACD is staying well above signal line.
•The development argues that fall from 100.42 might be completed at 84.05 already.
•Further rise will be mildly in favor as long as 86.17 minor support holds.
•Strong rally would be seen to 93.66 resistance to confirm the bullish case.
•Though, below 86.17 will flip bias back to the downside for another low below 84.05.
[Written by oilngold]
Image
↓↓↓ Click to learn more! ↓↓↓
Code: Select all
https://docs.google.com/spreadsheet/pub?key=0AhxKzvQ2GlM8dDBqYWl6XzlEbFZDWFVob0FMbG9nbGc&output=html

See also
~~~> _https://docs.google.com/file/d/0BxxKzvQ2GlM8MjZhMjY4ZjAtZTA3Yi00MTZmLWJhZTQtN2ExODI3NGUxYzQz/preview
↑↑↑ OR ↓↓↓
~~~> _http://img547.imageshack.us/img547/2082/12nov26.pdf
A d d i t i o n a l l y
FOREX MetaTrader Expert Advisors
Point & Figure :) :( Chart in Forex
User avatar
MDunleavy
 
Posts: 284
Joined: Fri Oct 30, 2009 1:43 am

Re: Point and Figure for Forex. Any pair.Charts.

Postby MDunleavy » Mon Dec 10, 2012 2:46 am

—The GBP/USD fell friday to trade at 1.6010 after the Bank of England yesterday held rates and policy.
—Today, industrial production and manufacturing production both disappointed markets reporting well below forecast, casting a greater doubt on the UK economy.
—Just a few days ago, the UK downgraded growth for 2013 and Chancellor Osborne, presented the Autumn statement with a negative forecast. [Written by forextv]
Image
Click to learn more!~~~> _http://goo.gl/VAvNX
Attachments
12Dec09.pdf
(79.08 KiB) Downloaded 1579 times
FOREX MetaTrader Expert Advisors
Point & Figure :) :( Chart in Forex
User avatar
MDunleavy
 
Posts: 284
Joined: Fri Oct 30, 2009 1:43 am

Re: Point and Figure for Forex. Any pair.Charts.

Postby MDunleavy » Mon Dec 17, 2012 3:36 am

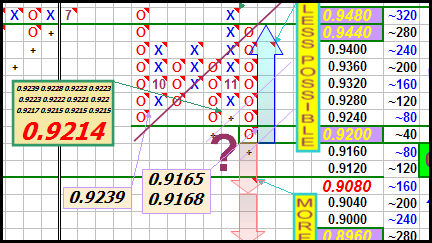
—USDCHF Analysis - December 17, 2012
—USDCHF breaks below 0.9214 support, suggesting that the downtrend from 0.9971 has resumed.
—Further decline could be expected next week, and next target would be at 0.9000 area.
—Resistance levels are at 0.9300 and 0.9400, as long as these levels hold, the downtrend from 0.9511 will continue.
—For long term analysis, USDCHF had formed a cycle top at 0.9971 on weekly chart.
—Further decline to 0.8500 area would likely be seen over the next several months.[Written by ForexCycle]
Image
Click to learn more!~~~> _http://goo.gl/FI6A0
||BJF Trading Group||Expert Advisor||MT Indicator||Forex Software||MQL4 Coding||
Attachments
12Dec17.pdf
(80.95 KiB) Downloaded 1336 times
FOREX MetaTrader Expert Advisors
Point & Figure :) :( Chart in Forex
User avatar
MDunleavy
 
Posts: 284
Joined: Fri Oct 30, 2009 1:43 am

Re: Point and Figure for Forex. Any pair.Charts.

Postby MDunleavy » Sun Dec 30, 2012 2:46 am

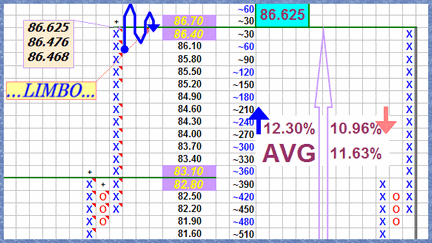
USDJPY Analysis - December 29, 2012
—USDJPY's upward movement from 77.14 extends to as high as 86.63.
—Further rise could be expected after consolidation, and next target would be at 88.00 area.
—Support is at 85.50 followed by 84.50, as long as these levels hold, the uptrend will continue.
—For long term analysis, USDJPY had formed a cycle bottom at 77.14 on weekly chart.
—Further rise to 90.00 area is possible over the next several weeks. [ Written by ForexCycle]
Image
Click to learn more! ~~~> _http://goo.gl/YmhM6

||BJF Trading Group||Expert Advisor||MT Indicator||Forex Software||MQL4 Coding||
Attachments
12Dec29.pdf
(90.29 KiB) Downloaded 1194 times
FOREX MetaTrader Expert Advisors
Point & Figure :) :( Chart in Forex
User avatar
MDunleavy
 
Posts: 284
Joined: Fri Oct 30, 2009 1:43 am

Previous

Return to Forex Trader Journals


cron